Estimated Value: $446,000 - $620,000
4
Beds
2
Baths
1,582
Sq Ft
$354/Sq Ft
Est. Value
About This Home
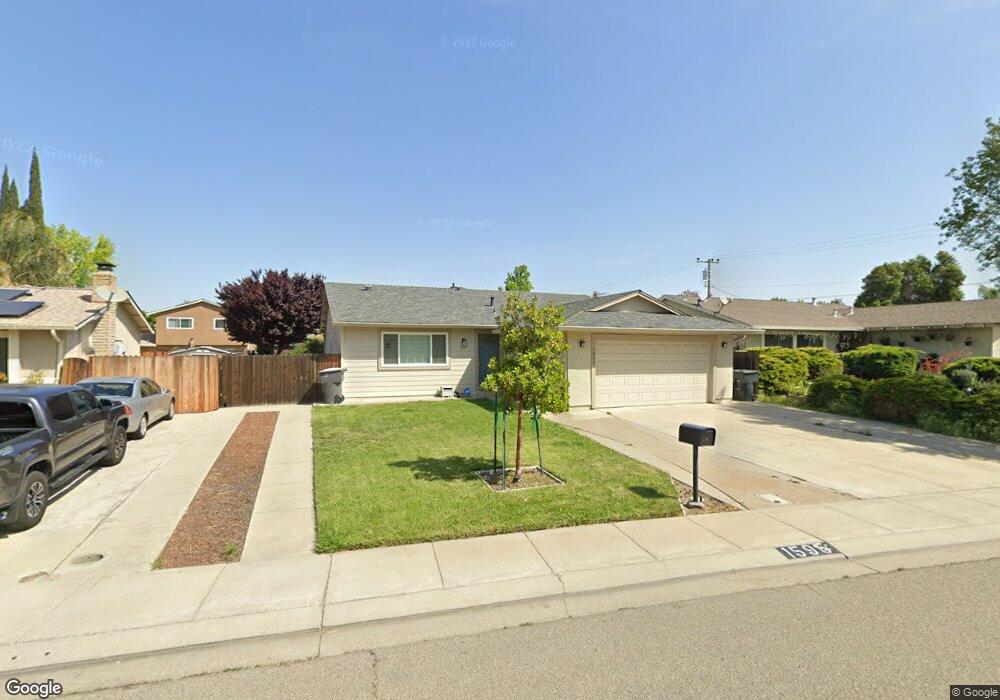
This home is located at 1595 Valerie Ln, Tracy, CA 95376 and is currently estimated at $560,179, approximately $354 per square foot. 1595 Valerie Ln is a home located in San Joaquin County with nearby schools including McKinley Elementary School, Monte Vista Middle School, and Merrill F. West High School.
Ownership History
Date
Name
Owned For
Owner Type
Purchase Details
Closed on
Jan 6, 2006
Sold by
Secrest Donald G and Secrest Jeann R
Bought by
Secrest Donald G and Secrest Jeanne R
Current Estimated Value
Purchase Details
Closed on
Sep 11, 2003
Sold by
Bridges Jeanne R
Bought by
Secrest Donald G and Secrest Jeanne K
Purchase Details
Closed on
Sep 14, 2000
Sold by
Bridges Jeanne and Bridges Jeanne R
Bought by
Bridges Jeanne
Home Financials for this Owner
Home Financials are based on the most recent Mortgage that was taken out on this home.
Original Mortgage
$162,000
Interest Rate
7.98%
Mortgage Type
Purchase Money Mortgage
Purchase Details
Closed on
Jun 22, 2000
Sold by
Bridges David S
Bought by
Bridges Jeanne R
Purchase Details
Closed on
Sep 18, 1995
Sold by
Searcy Donald A and Searcy Linda L
Bought by
Bridges David S and Bridges Jeanne R
Create a Home Valuation Report for This Property
The Home Valuation Report is an in-depth analysis detailing your home's value as well as a comparison with similar homes in the area
Home Values in the Area
Average Home Value in this Area
Purchase History
| Date | Buyer | Sale Price | Title Company |
|---|---|---|---|
| Secrest Donald G | -- | None Available | |
| Secrest Donald G | -- | None Available | |
| Secrest Donald G | -- | -- | |
| Bridges Jeanne | -- | Fidelity National Title Co | |
| Bridges Jeanne R | -- | -- | |
| Bridges David S | -- | -- |
Source: Public Records
Mortgage History
| Date | Status | Borrower | Loan Amount |
|---|---|---|---|
| Previous Owner | Bridges Jeanne | $162,000 |
Source: Public Records
Tax History Compared to Growth
Tax History
| Year | Tax Paid | Tax Assessment Tax Assessment Total Assessment is a certain percentage of the fair market value that is determined by local assessors to be the total taxable value of land and additions on the property. | Land | Improvement |
|---|---|---|---|---|
| 2025 | $2,933 | $253,709 | $113,803 | $139,906 |
| 2024 | $2,702 | $248,735 | $111,572 | $137,163 |
| 2023 | $2,661 | $243,859 | $109,385 | $134,474 |
| 2022 | $2,606 | $239,079 | $107,241 | $131,838 |
| 2021 | $2,576 | $234,392 | $105,139 | $129,253 |
| 2020 | $2,559 | $231,989 | $104,061 | $127,928 |
| 2019 | $2,519 | $227,441 | $102,021 | $125,420 |
| 2018 | $2,477 | $222,982 | $100,021 | $122,961 |
| 2017 | $2,354 | $218,610 | $98,060 | $120,550 |
| 2016 | $2,383 | $214,324 | $96,137 | $118,187 |
| 2014 | $2,225 | $206,971 | $92,839 | $114,132 |
Source: Public Records
Map
Nearby Homes
- 1600 Valerie Ln
- 1427 Audrey Dr
- 1422 Greenwillow Way
- 1300 Richard Dr
- 1750 Laurelgrove Ln
- 1403 Promenade Cir
- 1830 Laurelgrove Ln
- 1533 Vinewood Way
- 1005 Wood Thrush Ln
- 1436 Chester Dr
- 1762 Ashtree Ct
- 8300 W 11th St
- 655 Alden Glen Dr
- 550 Fawn Glen Dr
- 1590 Doe Trail Ln
- 1865 Newport Ct
- 500 Chestnut Ave
- 1792 Chester Dr
- 1228 Bessie Ave
- 790 Everglades Ln
- 1601 Valerie Ln
- 1587 Valerie Ln
- 1590 Bondy Ln
- 1580 Bondy Ln
- 1611 Valerie Ln
- 1600 Bondy Ln
- 1581 Valerie Ln
- 1610 Bondy Ln
- 1594 Valerie Ln
- 1532 Bondy Ln
- 1557 Valerie Ln
- 1588 Valerie Ln
- 1621 Valerie Ln
- 1610 Valerie Ln
- 1572 Valerie Ln
- 1620 Bondy Ln
- 1620 Valerie Ln
- 1548 Valerie Ln
- 1631 Valerie Ln
- 1524 Bondy Ln