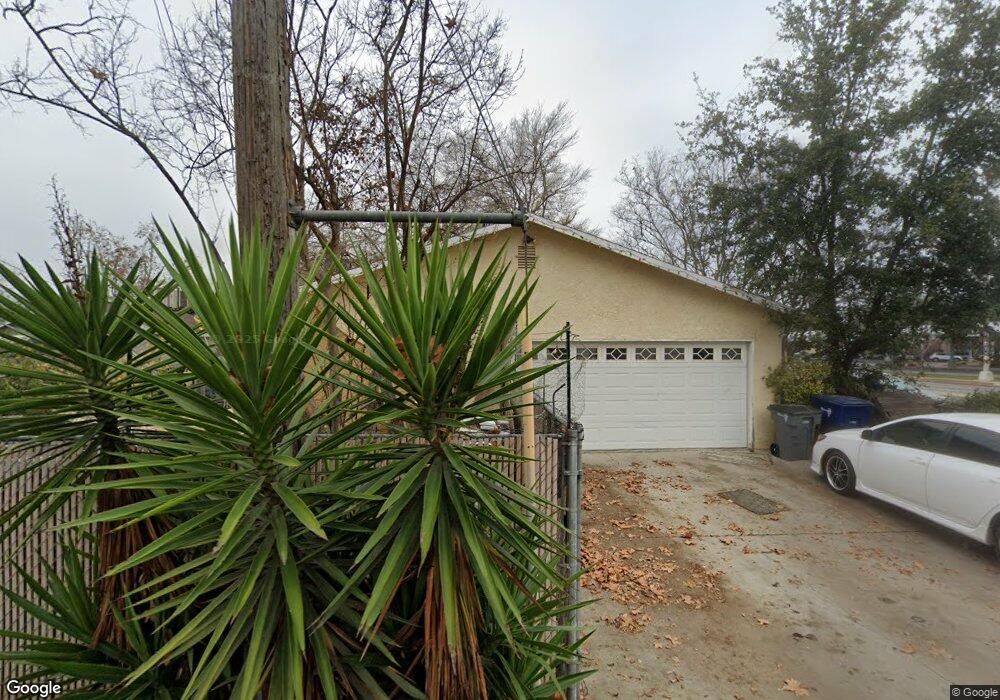
1598 N San Pablo Ave Fresno, CA 93728
Tower District NeighborhoodEstimated Value: $313,616 - $341,000
2
Beds
2
Baths
1,419
Sq Ft
$229/Sq Ft
Est. Value
About This Home
This home is located at 1598 N San Pablo Ave, Fresno, CA 93728 and is currently estimated at $324,404, approximately $228 per square foot. 1598 N San Pablo Ave is a home located in Fresno County with nearby schools including Heaton Elementary, Fort Miller Middle School, and Fresno High School.
Ownership History
Date
Name
Owned For
Owner Type
Purchase Details
Closed on
Jun 29, 2010
Sold by
Betancourt Raul and Betancourt Anne L
Bought by
King Geoff M
Current Estimated Value
Home Financials for this Owner
Home Financials are based on the most recent Mortgage that was taken out on this home.
Original Mortgage
$124,325
Outstanding Balance
$83,233
Interest Rate
4.87%
Mortgage Type
FHA
Estimated Equity
$241,171
Purchase Details
Closed on
Sep 22, 2006
Sold by
Betancourt Raul and Betancourt Anne L
Bought by
Betancourt Raul and Betancourt Anne L
Purchase Details
Closed on
Jul 27, 2000
Sold by
Fraga Patricia T
Bought by
Betancourt Raul and Betancourt Anne L
Home Financials for this Owner
Home Financials are based on the most recent Mortgage that was taken out on this home.
Original Mortgage
$63,400
Interest Rate
8.2%
Purchase Details
Closed on
Dec 2, 1996
Sold by
Patricia Fraga
Bought by
Fraga Patricia T
Create a Home Valuation Report for This Property
The Home Valuation Report is an in-depth analysis detailing your home's value as well as a comparison with similar homes in the area
Home Values in the Area
Average Home Value in this Area
Purchase History
| Date | Buyer | Sale Price | Title Company |
|---|---|---|---|
| King Geoff M | $126,000 | Chicago Title Company | |
| Betancourt Raul | -- | None Available | |
| Betancourt Raul | $79,500 | First American Title Co | |
| Fraga Patricia T | -- | -- |
Source: Public Records
Mortgage History
| Date | Status | Borrower | Loan Amount |
|---|---|---|---|
| Open | King Geoff M | $124,325 | |
| Previous Owner | Betancourt Raul | $63,400 |
Source: Public Records
Tax History Compared to Growth
Tax History
| Year | Tax Paid | Tax Assessment Tax Assessment Total Assessment is a certain percentage of the fair market value that is determined by local assessors to be the total taxable value of land and additions on the property. | Land | Improvement |
|---|---|---|---|---|
| 2025 | $2,042 | $161,416 | $25,617 | $135,799 |
| 2023 | $2,004 | $155,150 | $24,623 | $130,527 |
| 2022 | $1,977 | $152,109 | $24,141 | $127,968 |
| 2021 | $1,923 | $149,127 | $23,668 | $125,459 |
| 2020 | $1,915 | $147,599 | $23,426 | $124,173 |
| 2019 | $1,842 | $144,706 | $22,967 | $121,739 |
| 2018 | $1,802 | $141,869 | $22,517 | $119,352 |
| 2017 | $1,772 | $139,088 | $22,076 | $117,012 |
| 2016 | $1,714 | $136,362 | $21,644 | $114,718 |
| 2015 | $1,688 | $134,314 | $21,319 | $112,995 |
| 2014 | $1,655 | $131,684 | $20,902 | $110,782 |
Source: Public Records
Map
Nearby Homes
- 1452 N Poplar Ave
- 1504 N Van Ness Ave
- 1334 N Glenn Ave
- 1303 N Calaveras St
- 1250 E Vassar Ave
- 1311 N Van Ness Ave
- 721 E Home Ave
- 666 E Carmen Ave
- 626 E University Ave
- 1211 E Clinton Ave
- 1220 N Abby St
- 605 E Home Ave
- 1415 N Howard Ave
- 2121 E Hammond Ave
- 2126 N Van Ness Blvd
- 1835 E Clay Ave
- 718 E Clinton Ave
- 1145 E Harvard Ave
- 1591 N Roosevelt Ave
- 2240 N Van Ness Blvd
- 1584 N San Pablo Ave
- 1576 N San Pablo Ave
- 1597 N Glenn Ave
- 1568 N San Pablo Ave
- 1589 N Glenn Ave
- 1577 N Glenn Ave
- 1560 N San Pablo Ave
- 1571 N Glenn Ave
- 1565 N Glenn Ave
- 1550 N San Pablo Ave
- 1563 N Glenn Ave
- 1542 N San Pablo Ave
- 1557 N Glenn Ave
- 1598 N Glenn Ave
- 1592 N Glenn Ave
- 1588 N Glenn Ave
- 1582 N Glenn Ave
- 1536 N San Pablo Ave
- 1578 N Glenn Ave
- 1535 N Glenn Ave