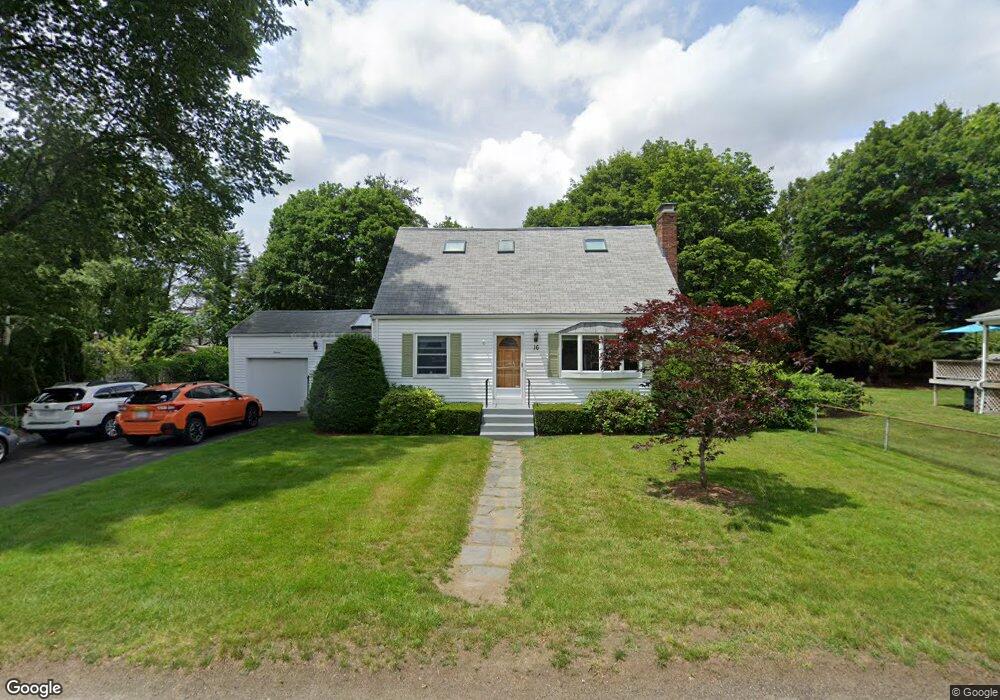
16 2nd St Natick, MA 01760
Estimated Value: $781,624 - $844,000
4
Beds
2
Baths
1,596
Sq Ft
$515/Sq Ft
Est. Value
About This Home
This home is located at 16 2nd St, Natick, MA 01760 and is currently estimated at $821,156, approximately $514 per square foot. 16 2nd St is a home located in Middlesex County with nearby schools including Natick High School, Wilson Middle School, and Bennett-Hemenway (Ben-Hem) Elementary School.
Ownership History
Date
Name
Owned For
Owner Type
Purchase Details
Closed on
Jun 30, 2003
Sold by
Chamberlain George and Chamberlain Suzanne
Bought by
Carignan Christopher and Carignan Christina A
Current Estimated Value
Home Financials for this Owner
Home Financials are based on the most recent Mortgage that was taken out on this home.
Original Mortgage
$320,000
Outstanding Balance
$130,415
Interest Rate
5.53%
Mortgage Type
Purchase Money Mortgage
Estimated Equity
$690,741
Create a Home Valuation Report for This Property
The Home Valuation Report is an in-depth analysis detailing your home's value as well as a comparison with similar homes in the area
Home Values in the Area
Average Home Value in this Area
Purchase History
| Date | Buyer | Sale Price | Title Company |
|---|---|---|---|
| Carignan Christopher | $390,000 | -- |
Source: Public Records
Mortgage History
| Date | Status | Borrower | Loan Amount |
|---|---|---|---|
| Open | Carignan Christopher | $320,000 |
Source: Public Records
Tax History
| Year | Tax Paid | Tax Assessment Tax Assessment Total Assessment is a certain percentage of the fair market value that is determined by local assessors to be the total taxable value of land and additions on the property. | Land | Improvement |
|---|---|---|---|---|
| 2025 | $7,868 | $657,900 | $427,800 | $230,100 |
| 2024 | $7,578 | $618,100 | $402,600 | $215,500 |
| 2023 | $7,589 | $600,400 | $387,300 | $213,100 |
| 2022 | $7,334 | $549,800 | $351,800 | $198,000 |
| 2021 | $4,495 | $516,000 | $331,700 | $184,300 |
| 2020 | $6,819 | $501,000 | $316,700 | $184,300 |
| 2019 | $6,386 | $501,000 | $316,700 | $184,300 |
| 2018 | $5,815 | $445,600 | $301,600 | $144,000 |
| 2017 | $4,200 | $398,300 | $257,000 | $141,300 |
| 2016 | $5,102 | $376,000 | $236,000 | $140,000 |
| 2015 | $5,039 | $364,600 | $236,000 | $128,600 |
Source: Public Records
Map
Nearby Homes
- 27 2nd St
- 7 Jackson Ct Unit B
- 23 Lake St
- 36 Winnemay St
- 8 Clifton Rd
- 99 W Central St
- 89 W Central St
- 58 W Central St
- 7 High St
- 49 Summer St
- 45 Summer St
- 52 Washington St
- 15 Edwards Rd
- 63 Pond St
- 5 Reynolds Ave Unit 2
- 8 Edwards Road Aka 12
- 21 Kelsey Rd
- 20 Florence St Unit B
- 25 Forest Ave
- 6 Floral Avenue Extension
Your Personal Tour Guide
Ask me questions while you tour the home.