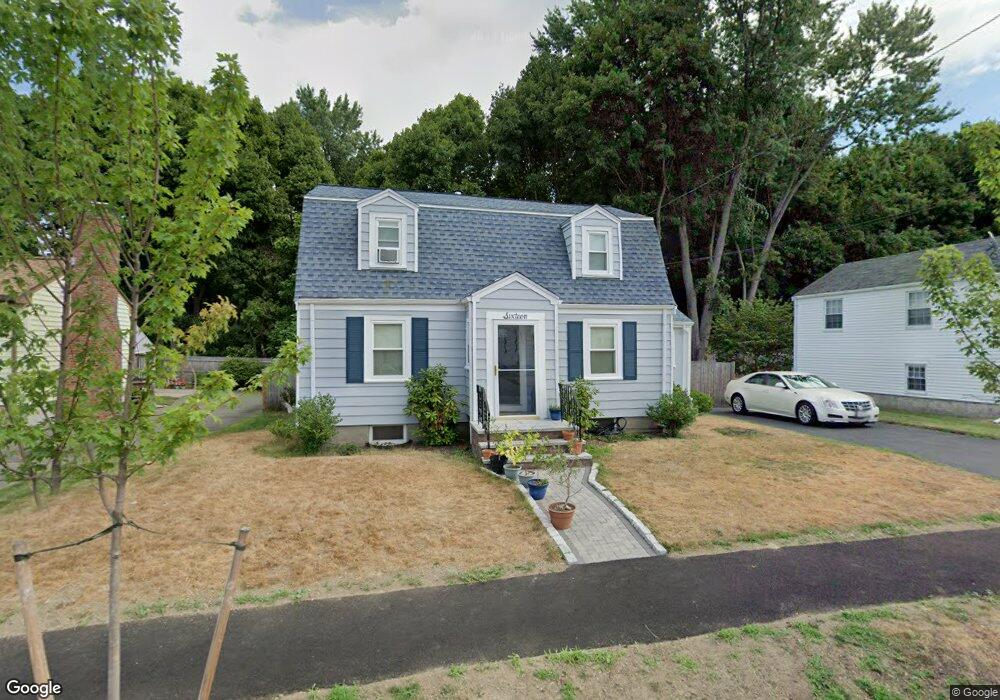
16 Alvin Ave Quincy, MA 02171
West Quincy NeighborhoodEstimated Value: $788,000 - $847,795
3
Beds
2
Baths
1,792
Sq Ft
$453/Sq Ft
Est. Value
About This Home
This home is located at 16 Alvin Ave, Quincy, MA 02171 and is currently estimated at $812,199, approximately $453 per square foot. 16 Alvin Ave is a home located in Norfolk County with nearby schools including Montclair Elementary School, Atlantic Middle School, and North Quincy High School.
Ownership History
Date
Name
Owned For
Owner Type
Purchase Details
Closed on
Dec 3, 2022
Sold by
Maranian Ronald E and Maranian Anastasia J
Bought by
Maranian Ft
Current Estimated Value
Purchase Details
Closed on
Apr 30, 1992
Sold by
Piscatelli Ft
Bought by
Maranian Ronald E
Home Financials for this Owner
Home Financials are based on the most recent Mortgage that was taken out on this home.
Original Mortgage
$120,000
Interest Rate
8.96%
Mortgage Type
Purchase Money Mortgage
Create a Home Valuation Report for This Property
The Home Valuation Report is an in-depth analysis detailing your home's value as well as a comparison with similar homes in the area
Home Values in the Area
Average Home Value in this Area
Purchase History
| Date | Buyer | Sale Price | Title Company |
|---|---|---|---|
| Maranian Ft | -- | None Available | |
| Maranian Ronald E | $156,000 | -- |
Source: Public Records
Mortgage History
| Date | Status | Borrower | Loan Amount |
|---|---|---|---|
| Previous Owner | Maranian Ronald E | $113,000 | |
| Previous Owner | Maranian Ronald E | $120,000 |
Source: Public Records
Tax History Compared to Growth
Tax History
| Year | Tax Paid | Tax Assessment Tax Assessment Total Assessment is a certain percentage of the fair market value that is determined by local assessors to be the total taxable value of land and additions on the property. | Land | Improvement |
|---|---|---|---|---|
| 2025 | $8,390 | $727,700 | $350,300 | $377,400 |
| 2024 | $8,166 | $724,600 | $350,300 | $374,300 |
| 2023 | $7,232 | $649,800 | $333,600 | $316,200 |
| 2022 | $7,012 | $585,300 | $290,100 | $295,200 |
| 2021 | $6,760 | $556,800 | $276,300 | $280,500 |
| 2020 | $6,665 | $536,200 | $276,300 | $259,900 |
| 2019 | $6,344 | $505,500 | $258,200 | $247,300 |
| 2018 | $6,235 | $467,400 | $239,100 | $228,300 |
| 2017 | $5,987 | $422,500 | $227,700 | $194,800 |
| 2016 | $5,448 | $379,400 | $198,000 | $181,400 |
| 2015 | $5,158 | $353,300 | $180,000 | $173,300 |
| 2014 | $4,957 | $333,600 | $171,400 | $162,200 |
Source: Public Records
Map
Nearby Homes
- 51 Denmark Ave
- 55 Christopher Dr
- 71 Cabot St
- 171 Milton St
- 129-131 Pine St
- 400 Adams St Unit A
- 400 Adams St Unit B
- 11 Rockwell Ave
- 397 Adams St
- 115 W Squantum St Unit 907
- 115 W Squantum St Unit 810
- 169 Pine St
- 60 Pond St
- 639 Pleasant St Unit 639
- 639 Pleasant St
- 121 Hillside Ave
- 41 Wallace Rd
- 1111 Brook Rd
- 17 Holmes St Unit 2
- 17 Holmes St Unit 4