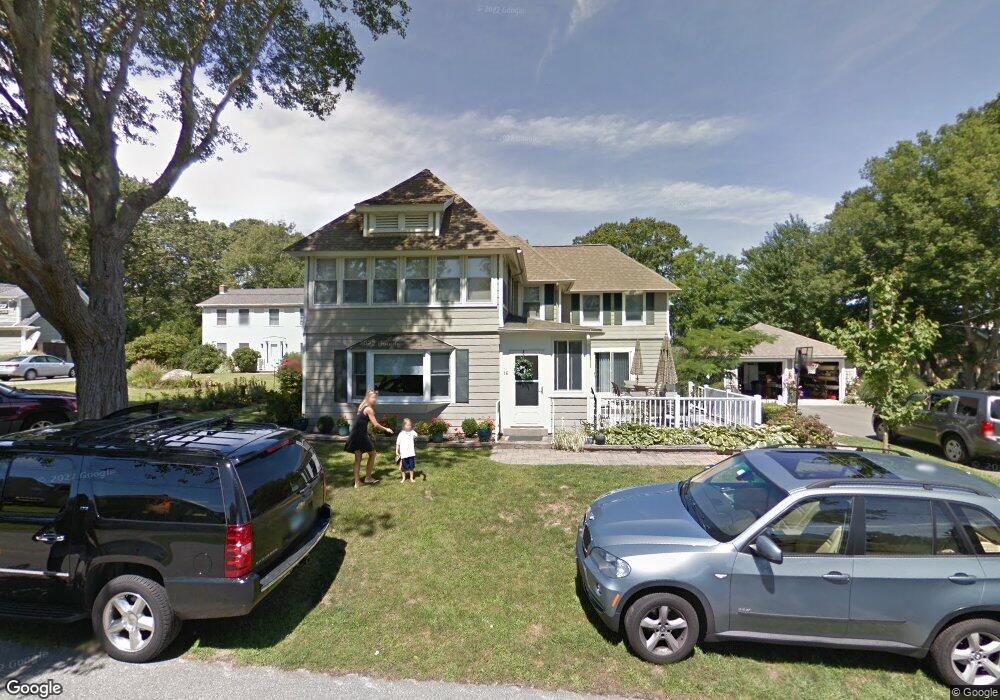
16 Attawan Ave Niantic, CT 06357
Niantic NeighborhoodEstimated Value: $987,529 - $1,312,000
5
Beds
3
Baths
3,128
Sq Ft
$353/Sq Ft
Est. Value
About This Home
This home is located at 16 Attawan Ave, Niantic, CT 06357 and is currently estimated at $1,104,382, approximately $353 per square foot. 16 Attawan Ave is a home located in New London County with nearby schools including East Lyme Middle School, East Lyme High School, and The Light House Voc-Ed Center.
Ownership History
Date
Name
Owned For
Owner Type
Purchase Details
Closed on
Sep 22, 2014
Sold by
Snayd Judith M
Bought by
Snayd Judith M
Current Estimated Value
Purchase Details
Closed on
Jul 30, 1993
Sold by
Mahoney Helen T
Bought by
Snayd Richard T and Snyad Judith M
Home Financials for this Owner
Home Financials are based on the most recent Mortgage that was taken out on this home.
Original Mortgage
$70,000
Interest Rate
7.32%
Mortgage Type
Purchase Money Mortgage
Create a Home Valuation Report for This Property
The Home Valuation Report is an in-depth analysis detailing your home's value as well as a comparison with similar homes in the area
Home Values in the Area
Average Home Value in this Area
Purchase History
| Date | Buyer | Sale Price | Title Company |
|---|---|---|---|
| Snayd Judith M | -- | -- | |
| Snayd Judith M | -- | -- | |
| Snayd Richard T | $140,000 | -- | |
| Snayd Judith M | -- | -- |
Source: Public Records
Mortgage History
| Date | Status | Borrower | Loan Amount |
|---|---|---|---|
| Previous Owner | Snayd Richard T | $70,000 |
Source: Public Records
Tax History Compared to Growth
Tax History
| Year | Tax Paid | Tax Assessment Tax Assessment Total Assessment is a certain percentage of the fair market value that is determined by local assessors to be the total taxable value of land and additions on the property. | Land | Improvement |
|---|---|---|---|---|
| 2025 | $13,101 | $467,740 | $243,180 | $224,560 |
| 2024 | $12,325 | $467,740 | $243,180 | $224,560 |
| 2023 | $11,244 | $451,920 | $243,180 | $208,740 |
| 2022 | $10,774 | $451,920 | $243,180 | $208,740 |
| 2021 | $9,027 | $316,610 | $184,380 | $132,230 |
| 2020 | $8,985 | $316,820 | $184,380 | $132,440 |
| 2019 | $8,791 | $311,850 | $184,380 | $127,470 |
| 2018 | $8,529 | $311,850 | $184,380 | $127,470 |
| 2017 | $8,158 | $311,850 | $184,380 | $127,470 |
| 2016 | $8,113 | $319,900 | $184,380 | $135,520 |
| 2015 | $7,905 | $319,900 | $184,380 | $135,520 |
| 2014 | $7,687 | $319,900 | $184,380 | $135,520 |
Source: Public Records
Map
Nearby Homes
- 5 Attawan Ave
- 43 Attawan Ave
- 7 Old Black Point Rd
- 48 Billow Rd
- 146 Black Point Rd
- 23 Central Ave
- 127 Black Point Rd Unit 7
- 11 Sunset Ave
- 61 Terrace Ave
- 46 Old Black Point Rd
- 68-70 Black Point Rd
- 9 Columbus Ave
- 43 Village Crossing Unit 43
- 47 Village Crossing Unit 47
- 3 Village Crossing Unit 3
- 15 Griswold Rd
- 40 Spinnaker Dr
- 46 Village Crossing Unit 46
- 48 Village Crossing Unit 48
- 3 Pattagansett Ct