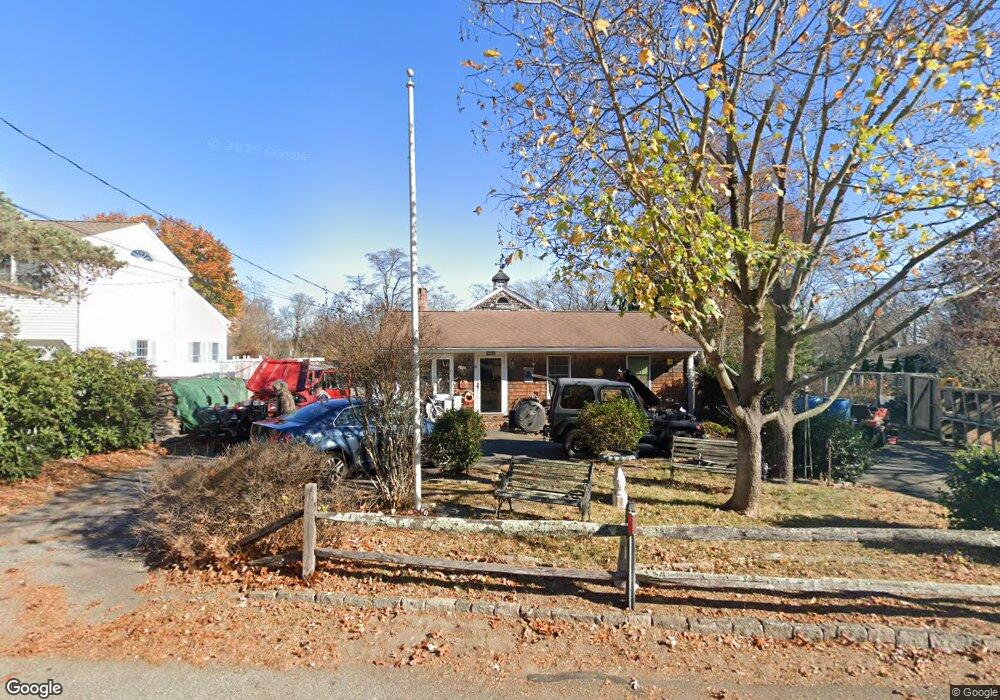
16 Attawan Rd Niantic, CT 06357
Niantic NeighborhoodEstimated Value: $509,204 - $779,000
2
Beds
2
Baths
1,628
Sq Ft
$373/Sq Ft
Est. Value
About This Home
This home is located at 16 Attawan Rd, Niantic, CT 06357 and is currently estimated at $607,551, approximately $373 per square foot. 16 Attawan Rd is a home located in New London County with nearby schools including East Lyme Middle School, East Lyme High School, and The Light House Voc-Ed Center.
Ownership History
Date
Name
Owned For
Owner Type
Purchase Details
Closed on
Dec 4, 2000
Sold by
Nebelung Beverly R
Bought by
Marone Gary L
Current Estimated Value
Purchase Details
Closed on
Oct 7, 1998
Sold by
Nebelung Michael J and Nebelung Alexander H
Bought by
Bonelli John A
Purchase Details
Closed on
Feb 8, 1989
Sold by
Mackey Alfred
Bought by
Johnson Frederick
Create a Home Valuation Report for This Property
The Home Valuation Report is an in-depth analysis detailing your home's value as well as a comparison with similar homes in the area
Home Values in the Area
Average Home Value in this Area
Purchase History
| Date | Buyer | Sale Price | Title Company |
|---|---|---|---|
| Marone Gary L | $105,000 | -- | |
| Bonelli John A | $45,000 | -- | |
| Marone Gary L | $105,000 | -- | |
| Bonelli John A | $45,000 | -- | |
| Johnson Frederick | $132,500 | -- |
Source: Public Records
Mortgage History
| Date | Status | Borrower | Loan Amount |
|---|---|---|---|
| Open | Johnson Frederick | $277,005 | |
| Closed | Johnson Frederick | $253,000 |
Source: Public Records
Tax History
| Year | Tax Paid | Tax Assessment Tax Assessment Total Assessment is a certain percentage of the fair market value that is determined by local assessors to be the total taxable value of land and additions on the property. | Land | Improvement |
|---|---|---|---|---|
| 2025 | $6,296 | $224,770 | $89,880 | $134,890 |
| 2024 | $5,923 | $224,770 | $89,880 | $134,890 |
| 2023 | $5,592 | $224,770 | $89,880 | $134,890 |
| 2022 | $5,359 | $224,770 | $89,880 | $134,890 |
| 2021 | $5,041 | $176,820 | $85,750 | $91,070 |
| 2020 | $5,015 | $176,820 | $85,750 | $91,070 |
| 2019 | $4,985 | $176,820 | $85,750 | $91,070 |
| 2018 | $4,836 | $176,820 | $85,750 | $91,070 |
| 2017 | $4,626 | $176,820 | $85,750 | $91,070 |
| 2016 | $4,916 | $193,830 | $106,120 | $87,710 |
| 2015 | $4,824 | $195,230 | $106,120 | $89,110 |
| 2014 | $4,691 | $195,230 | $106,120 | $89,110 |
Source: Public Records
Map
Nearby Homes
- 36 Attawan Rd
- 26 Mohawk Dr
- 127 Black Point Rd Unit 7
- 42 S Washington Ave
- 61 Whitecap Rd
- 19 Sapia Dr
- 468 Main St Unit 318
- 468 Main St Unit 111
- 43 Village Crossing Unit 43
- 47 Village Crossing Unit 47
- 12 Spinnaker Dr
- 46 Village Crossing Unit 46
- 18 Compass Ct
- 31 Regatta Dr
- 97 W Main St Unit 36
- 15 Griswold Rd
- 55 Corey Ln
- 185 Main St Unit 301
- 185 Main St Unit 305
- 43 Roxbury Ct
Your Personal Tour Guide
Ask me questions while you tour the home.