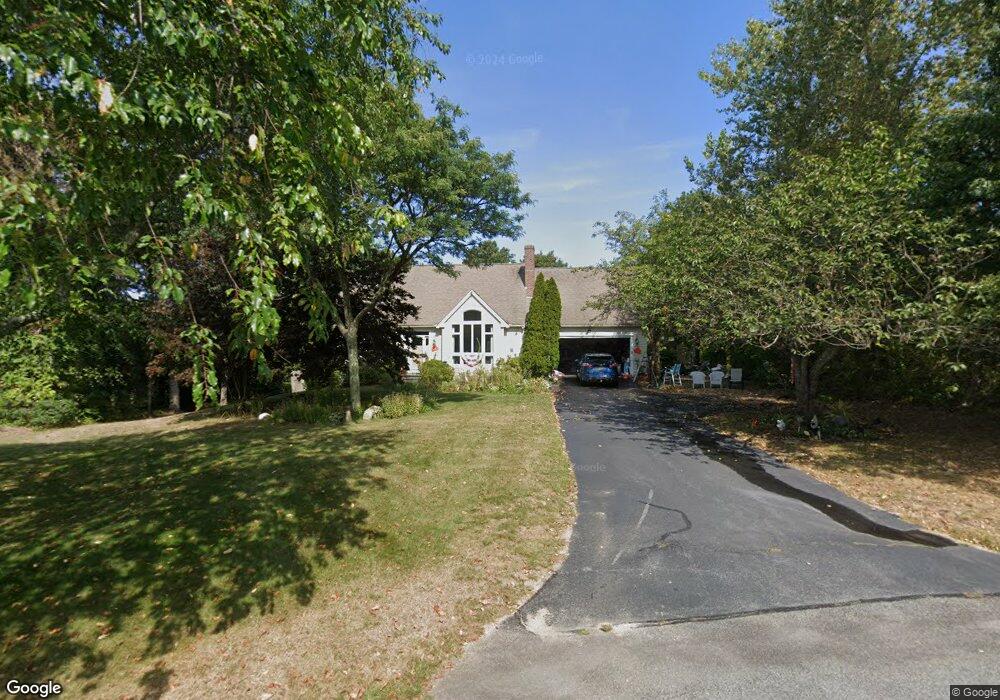
16 Brookside Cir Mashpee, MA 02649
Seabrook NeighborhoodEstimated Value: $1,035,605 - $1,114,000
4
Beds
3
Baths
1,501
Sq Ft
$713/Sq Ft
Est. Value
About This Home
This home is located at 16 Brookside Cir, Mashpee, MA 02649 and is currently estimated at $1,069,651, approximately $712 per square foot. 16 Brookside Cir is a home located in Barnstable County with nearby schools including Kenneth C. Coombs School, Quashnet School, and Mashpee Middle School.
Ownership History
Date
Name
Owned For
Owner Type
Purchase Details
Closed on
Dec 13, 1995
Sold by
Redbrook Corp
Bought by
Regan James E
Current Estimated Value
Home Financials for this Owner
Home Financials are based on the most recent Mortgage that was taken out on this home.
Original Mortgage
$144,000
Outstanding Balance
$2,963
Interest Rate
7.43%
Mortgage Type
Purchase Money Mortgage
Estimated Equity
$1,066,688
Create a Home Valuation Report for This Property
The Home Valuation Report is an in-depth analysis detailing your home's value as well as a comparison with similar homes in the area
Home Values in the Area
Average Home Value in this Area
Purchase History
| Date | Buyer | Sale Price | Title Company |
|---|---|---|---|
| Regan James E | $35,000 | -- |
Source: Public Records
Mortgage History
| Date | Status | Borrower | Loan Amount |
|---|---|---|---|
| Open | Regan James E | $144,000 |
Source: Public Records
Tax History
| Year | Tax Paid | Tax Assessment Tax Assessment Total Assessment is a certain percentage of the fair market value that is determined by local assessors to be the total taxable value of land and additions on the property. | Land | Improvement |
|---|---|---|---|---|
| 2025 | $6,390 | $965,300 | $362,700 | $602,600 |
| 2024 | $5,813 | $904,100 | $329,700 | $574,400 |
| 2023 | $5,340 | $761,700 | $289,800 | $471,900 |
| 2022 | $5,080 | $621,800 | $235,600 | $386,200 |
| 2021 | $4,955 | $546,300 | $212,300 | $334,000 |
| 2020 | $4,816 | $529,800 | $204,100 | $325,700 |
| 2019 | $4,771 | $527,200 | $221,100 | $306,100 |
| 2018 | $0 | $521,600 | $221,100 | $300,500 |
| 2017 | $4,538 | $493,800 | $221,100 | $272,700 |
| 2016 | $4,415 | $477,800 | $221,100 | $256,700 |
| 2015 | $4,254 | $467,000 | $221,100 | $245,900 |
| 2014 | $4,056 | $432,000 | $186,700 | $245,300 |
Source: Public Records
Map
Nearby Homes
- 35 Bayshore Dr
- 240 Surf Dr
- 42 Overlook Cir
- 61 Wintergreen Rd
- 29 Carl Landi Cir
- 7 Sandy Way
- 12 Wintergreen Rd
- 9 Point Rd
- 197 Monomoscoy Rd
- 36 Carriage Shop Rd
- 56 Carriage Shop Rd Unit 4
- 89 Degrass Rd
- 381 Great Oak Rd Unit 9
- 50 Topping Lift
- 17 Degrass Rd
- 11 Rosewood Cir
- 72 Walton Heath Way
- 97 Walton Heath Way
- 36 Rosewood Cir
- 49 Four Seasons Dr
- 15 Brookside Cir
- 12 Brookside Cir
- 8 Brookside Cir
- 13 Brookside Cir
- 7 Brookside Cir
- 4 Brookside Cir
- 4 Monomoscoy Rd
- 5 Bayshore Dr
- 389 Red Brook Rd
- 3 Bayshore Dr
- 175 Red Brook Rd
- 17 Bayshore Dr
- 36 Ostrom Rd
- 30 Ostrom Rd
- 399 Red Brook Rd
- 40 Ostrom Rd
- 121 Meadowbrook Rd
- 379 Red Brook Rd
- 379 Red Brook
- 8 Bayshore Dr
Your Personal Tour Guide
Ask me questions while you tour the home.