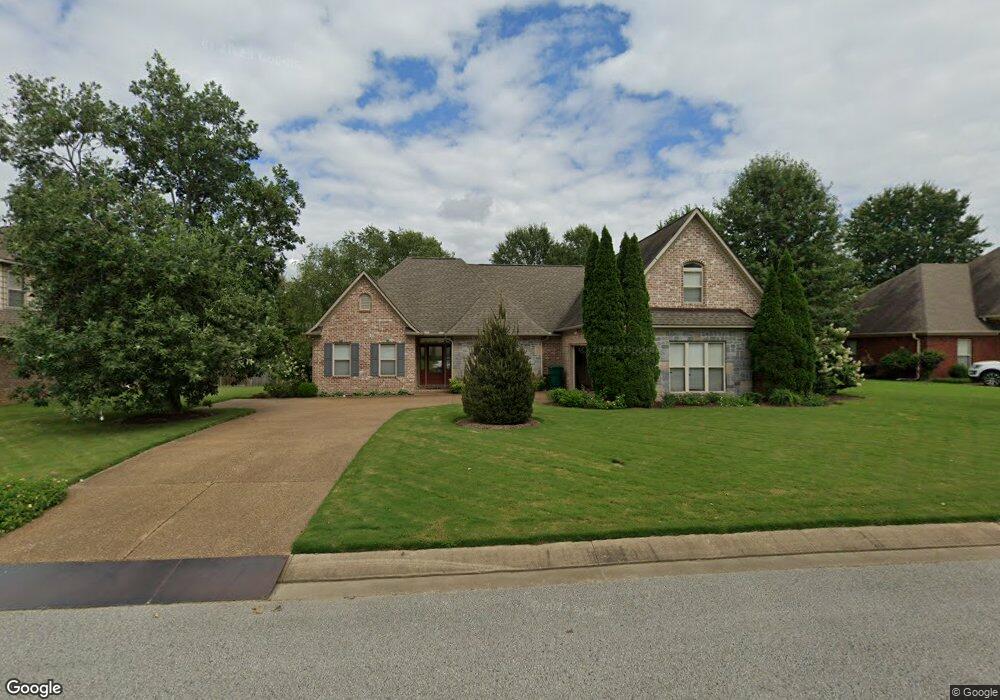
16 Cascade Cove Jackson, TN 38305
Estimated Value: $353,983 - $442,000
Studio
4
Baths
2,412
Sq Ft
$166/Sq Ft
Est. Value
About This Home
This home is located at 16 Cascade Cove, Jackson, TN 38305 and is currently estimated at $400,746, approximately $166 per square foot. 16 Cascade Cove is a home located in Madison County with nearby schools including Pope School, Northeast Middle School, and North Side High School.
Ownership History
Date
Name
Owned For
Owner Type
Purchase Details
Closed on
Jul 24, 2017
Sold by
Dunagan Daniel Oneal and Dunagan Janice Jeanette
Bought by
Dunagan Daniel Oneal and Dunagan Janice Jeanette
Current Estimated Value
Purchase Details
Closed on
Jul 20, 2017
Sold by
Hooper David
Bought by
Hooper David Livingston and David Livingston Hooper Jr Trust
Purchase Details
Closed on
May 23, 2006
Sold by
Bradley Smith
Bought by
David Hooper
Home Financials for this Owner
Home Financials are based on the most recent Mortgage that was taken out on this home.
Original Mortgage
$165,700
Outstanding Balance
$95,134
Interest Rate
6.44%
Estimated Equity
$305,612
Purchase Details
Closed on
May 22, 2006
Sold by
Bradley Smith
Bought by
David Hooper
Home Financials for this Owner
Home Financials are based on the most recent Mortgage that was taken out on this home.
Original Mortgage
$165,700
Outstanding Balance
$95,134
Interest Rate
6.44%
Estimated Equity
$305,612
Purchase Details
Closed on
Dec 30, 2004
Sold by
Tony King
Bought by
Bradley Smith
Purchase Details
Closed on
Feb 19, 2004
Bought by
King Tony
Create a Home Valuation Report for This Property
The Home Valuation Report is an in-depth analysis detailing your home's value as well as a comparison with similar homes in the area
Purchase History
| Date | Buyer | Sale Price | Title Company |
|---|---|---|---|
| Dunagan Daniel Oneal | -- | None Available | |
| Hooper David Livingston | -- | None Available | |
| David Hooper | $215,700 | -- | |
| David Hooper | $215,700 | -- | |
| Bradley Smith | $189,500 | -- | |
| King Tony | $29,000 | -- |
Source: Public Records
Mortgage History
| Date | Status | Borrower | Loan Amount |
|---|---|---|---|
| Open | King Tony | $165,700 |
Source: Public Records
Tax History
| Year | Tax Paid | Tax Assessment Tax Assessment Total Assessment is a certain percentage of the fair market value that is determined by local assessors to be the total taxable value of land and additions on the property. | Land | Improvement |
|---|---|---|---|---|
| 2025 | $1,246 | $66,525 | $10,500 | $56,025 |
| 2024 | $1,246 | $66,525 | $10,500 | $56,025 |
| 2022 | $2,318 | $66,525 | $10,500 | $56,025 |
| 2021 | $2,035 | $47,200 | $9,000 | $38,200 |
| 2020 | $2,035 | $47,200 | $9,000 | $38,200 |
| 2019 | $2,035 | $47,200 | $9,000 | $38,200 |
| 2018 | $2,035 | $47,200 | $9,000 | $38,200 |
| 2017 | $1,939 | $43,950 | $8,250 | $35,700 |
| 2016 | $1,807 | $43,950 | $8,250 | $35,700 |
| 2015 | $1,807 | $43,950 | $8,250 | $35,700 |
| 2014 | $1,807 | $43,950 | $8,250 | $35,700 |
Source: Public Records
Map
Nearby Homes
- 80 Wrights Mill Dr
- 97 Wrights Mill Dr
- 23 Kinnewick Cove
- 135 Windy City Rd
- 52 Kinnewick Cove
- 19 Ravenwood Dr
- 00 Windy City Rd
- 116 Ravenwood Dr
- 52 Buckingham Cove
- 115 Buckingham Cove
- 72 Swanbourne Cove
- 79 Swanbourne Cove
- 127 Larkwood Dr
- 114 Larkwood Dr
- 9 Citrus Springs Cove
- 159 Larkwood Dr
- 119 Bascom Rd
- 107 Wyndchase Dr
- 59 Larkson Ln
- 231 Tuckahoe Rd
- 8 Cascade Cove
- 24 Cascade Cove
- 17 Flagstone Dr
- 9 Flagstone Dr
- 25 Flagstone Dr
- 17 Cascade Cove
- 32 Cascade Cove
- 25 Cascade Cove
- 9 Cascade Cove
- 33 Flagstone Dr
- 25 Wrights Mill Dr
- 33 Wrights Mill Dr
- 17 Wrights Mill Dr
- 33 Cascade Cove
- 40 Cascade Cove
- 16 Flagstone Dr
- 41 Flagstone Dr
- 9 Wrights Mill Dr
- 8 Flagstone Dr
- 24 Flagstone Dr
Your Personal Tour Guide
Ask me questions while you tour the home.