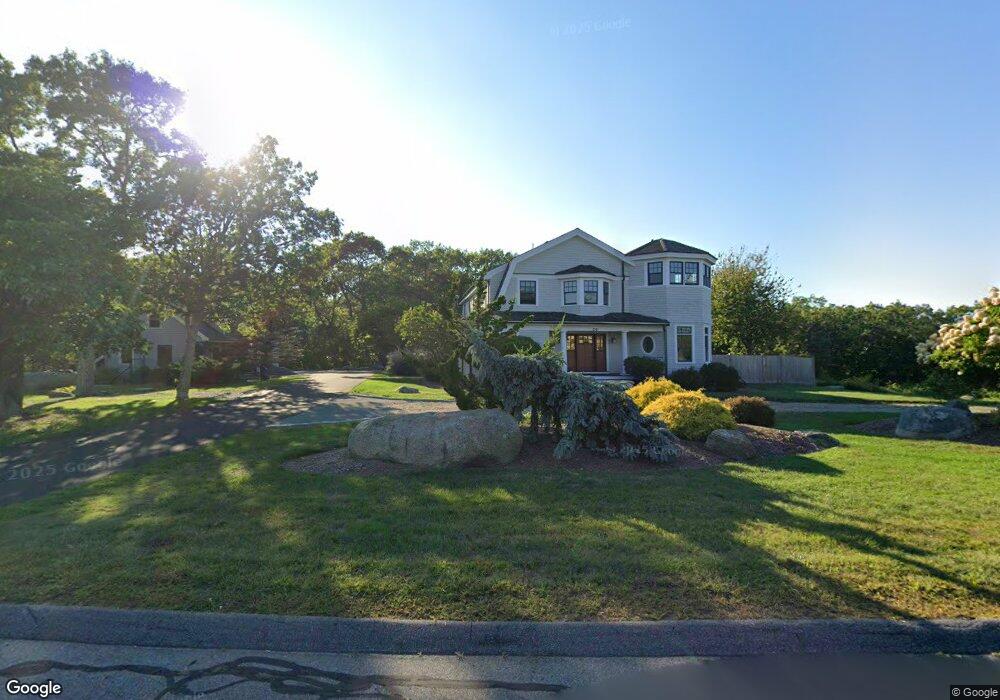
16 Castle View Dr Gloucester, MA 01930
West Gloucester NeighborhoodEstimated Value: $1,742,000 - $2,563,000
3
Beds
3
Baths
3,950
Sq Ft
$548/Sq Ft
Est. Value
About This Home
This home is located at 16 Castle View Dr, Gloucester, MA 01930 and is currently estimated at $2,164,580, approximately $547 per square foot. 16 Castle View Dr is a home located in Essex County with nearby schools including West Parish, Ralph B O'maley Middle School, and Gloucester High School.
Ownership History
Date
Name
Owned For
Owner Type
Purchase Details
Closed on
Nov 7, 2018
Sold by
Anderson Craig R
Bought by
Stclair Nt
Current Estimated Value
Home Financials for this Owner
Home Financials are based on the most recent Mortgage that was taken out on this home.
Original Mortgage
$920,000
Outstanding Balance
$786,093
Interest Rate
3.5%
Mortgage Type
Adjustable Rate Mortgage/ARM
Estimated Equity
$1,378,487
Create a Home Valuation Report for This Property
The Home Valuation Report is an in-depth analysis detailing your home's value as well as a comparison with similar homes in the area
Home Values in the Area
Average Home Value in this Area
Purchase History
| Date | Buyer | Sale Price | Title Company |
|---|---|---|---|
| Stclair Nt | $1,150,000 | -- |
Source: Public Records
Mortgage History
| Date | Status | Borrower | Loan Amount |
|---|---|---|---|
| Open | Stclair Nt | $920,000 |
Source: Public Records
Tax History
| Year | Tax Paid | Tax Assessment Tax Assessment Total Assessment is a certain percentage of the fair market value that is determined by local assessors to be the total taxable value of land and additions on the property. | Land | Improvement |
|---|---|---|---|---|
| 2025 | $17,588 | $1,809,500 | $373,200 | $1,436,300 |
| 2024 | $16,247 | $1,669,800 | $355,500 | $1,314,300 |
| 2023 | $15,586 | $1,471,800 | $317,400 | $1,154,400 |
| 2022 | $15,098 | $1,287,100 | $269,700 | $1,017,400 |
| 2021 | $14,632 | $1,176,200 | $245,500 | $930,700 |
| 2020 | $14,863 | $1,205,400 | $245,500 | $959,900 |
| 2019 | $14,010 | $1,104,000 | $245,500 | $858,500 |
| 2018 | $13,128 | $1,015,300 | $245,500 | $769,800 |
| 2017 | $14,601 | $1,107,000 | $359,800 | $747,200 |
| 2016 | $14,089 | $1,035,200 | $344,200 | $691,000 |
| 2015 | $13,314 | $975,400 | $336,300 | $639,100 |
Source: Public Records
Map
Nearby Homes
- 178 Atlantic St
- 226 Atlantic St
- 167 Atlantic St
- 2 Breezy Point Rd
- 672 Washington St
- 13 Honeysuckle Rd
- 3 Deacon Farm Ln
- 7 Leaman Dr
- 31 Echo Ave
- 7 Colburn St
- 5 Samoset Rd Unit B
- 368 Essex Ave
- 24 Cobblestone Ln Unit 603
- 5 Lepage Ln
- 145 Essex Ave Unit 402
- 13 Mystic Ave
- 6 Monroe Ct
- 8 Mystic Ave
- 587 Essex Ave
- 98 Maplewood Ave
- 18 Castle View Dr
- 26 Castle View Dr
- 17 Castle View Dr
- 17 Castle View Dr Unit 1
- 17 Castle View Dr Unit 2
- 15 Castle View Dr
- Lot 8 Castle View Dr
- 19 Castle View Dr
- 58 Castle View Dr
- 33 Castle View Dr
- 28 Castle View Dr
- 21 Castle View Dr
- 31 Castle View Dr
- 11 Castle View Dr
- 23 Castle View Dr
- 29 Castle View Dr
- 56 Castle View Dr
- 52 Castle View Dr
- 30 Castle View Dr
- 30 Castleview Dr
Your Personal Tour Guide
Ask me questions while you tour the home.