16 Dockser Ave Pocasset, MA 02559
Pocasset NeighborhoodEstimated Value: $408,000 - $445,000
2
Beds
1
Bath
804
Sq Ft
$532/Sq Ft
Est. Value
About This Home
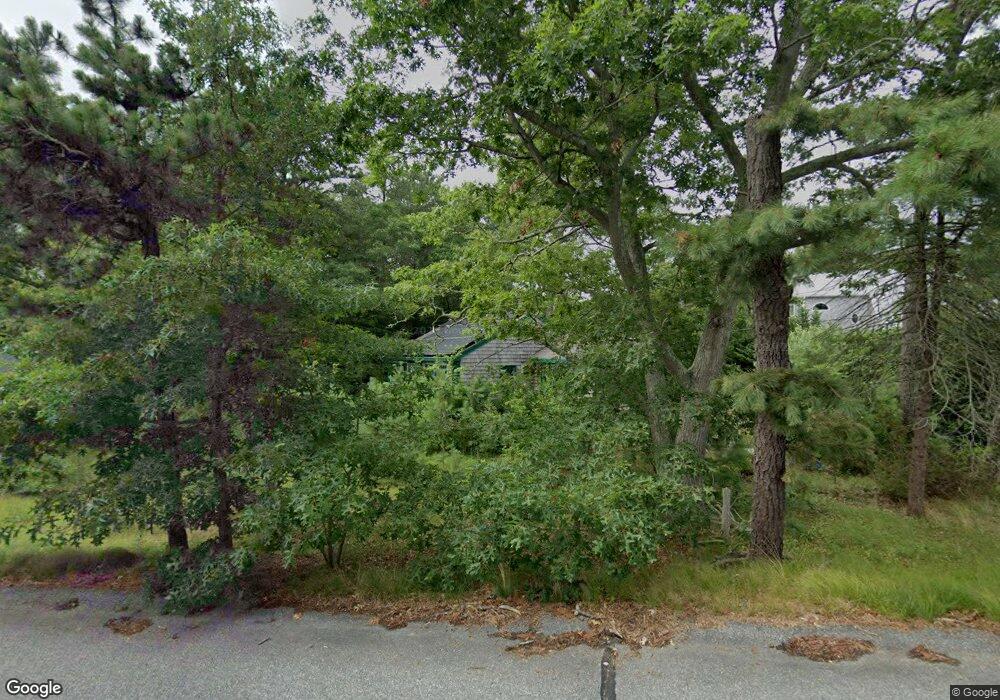
This home is located at 16 Dockser Ave, Pocasset, MA 02559 and is currently estimated at $427,945, approximately $532 per square foot. 16 Dockser Ave is a home located in Barnstable County with nearby schools including Bourne High School, Cadence Academy Preschool - Bourne, and St Margaret Regional School.
Ownership History
Date
Name
Owned For
Owner Type
Purchase Details
Closed on
Mar 17, 2015
Sold by
Mason David H
Bought by
David H Mason Irt and Mason
Current Estimated Value
Purchase Details
Closed on
Apr 1, 2011
Sold by
Shedd Phyllis E and Morton Edith M
Bought by
Mason David H
Home Financials for this Owner
Home Financials are based on the most recent Mortgage that was taken out on this home.
Original Mortgage
$84,000
Interest Rate
5.04%
Mortgage Type
Purchase Money Mortgage
Create a Home Valuation Report for This Property
The Home Valuation Report is an in-depth analysis detailing your home's value as well as a comparison with similar homes in the area
Home Values in the Area
Average Home Value in this Area
Purchase History
| Date | Buyer | Sale Price | Title Company |
|---|---|---|---|
| David H Mason Irt | -- | -- | |
| David H Mason Irt | -- | -- | |
| Mason David H | $140,000 | -- | |
| Mason David H | $140,000 | -- |
Source: Public Records
Mortgage History
| Date | Status | Borrower | Loan Amount |
|---|---|---|---|
| Previous Owner | Mason David H | $84,000 |
Source: Public Records
Tax History
| Year | Tax Paid | Tax Assessment Tax Assessment Total Assessment is a certain percentage of the fair market value that is determined by local assessors to be the total taxable value of land and additions on the property. | Land | Improvement |
|---|---|---|---|---|
| 2025 | $2,674 | $342,400 | $193,500 | $148,900 |
| 2024 | $2,749 | $342,800 | $201,000 | $141,800 |
| 2023 | $2,672 | $303,300 | $177,900 | $125,400 |
| 2022 | $2,457 | $243,500 | $144,300 | $99,200 |
| 2021 | $2,387 | $221,600 | $131,300 | $90,300 |
| 2020 | $2,316 | $215,600 | $130,100 | $85,500 |
| 2019 | $2,216 | $210,800 | $130,100 | $80,700 |
| 2018 | $2,132 | $202,300 | $129,500 | $72,800 |
| 2017 | $1,986 | $192,800 | $128,300 | $64,500 |
| 2016 | $1,854 | $182,500 | $128,300 | $54,200 |
| 2015 | $1,445 | $143,500 | $89,300 | $54,200 |
Source: Public Records
Map
Nearby Homes
- 7 4th Ave
- 3 4th Ave
- 3 1st St
- 709 County Rd
- 16 Michael Rd
- 254 Barlows Landing Rd
- 48 Red Brook Harbor Rd
- 1234 Route 28a
- 1234 Route 28a
- 14 Navajo Rd
- 20 Colony Ave
- 566 Shore Rd
- 15 Oak Ave
- 4 Harbor Hill Dr
- 31 Baxendale Rd
- 16 Amberwood Ct
- 75 Winsor Rd
- 12 Turnberry Rd Unit 12
- 203 County Rd
- 4 Hollyhock Knoll Ct Unit 4
Your Personal Tour Guide
Ask me questions while you tour the home.