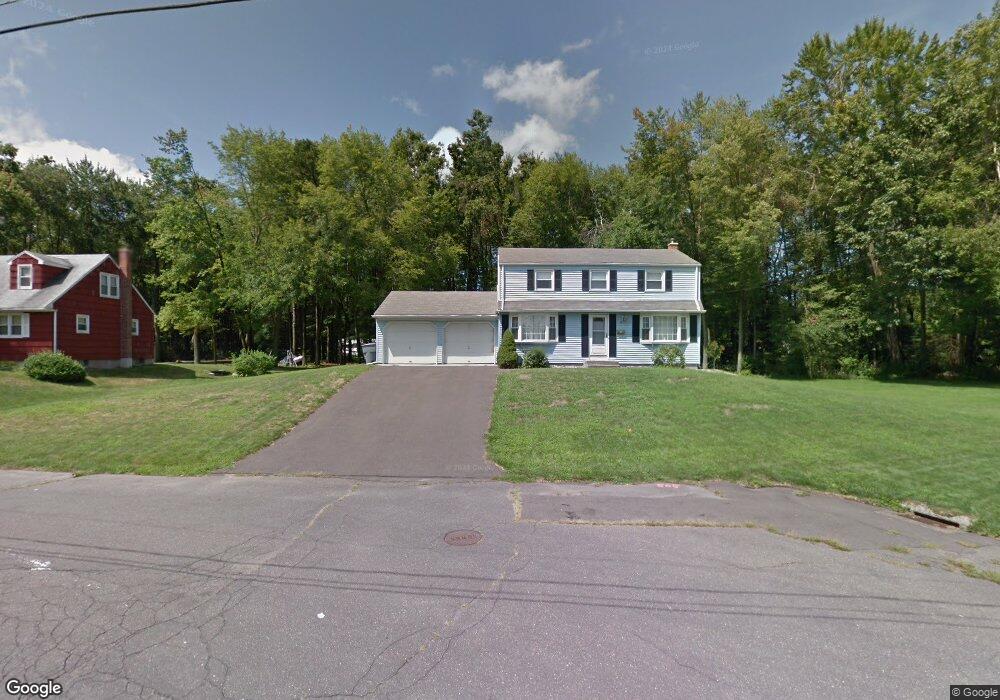
16 Duff Dr Enfield, CT 06082
Estimated Value: $370,080 - $404,000
4
Beds
2
Baths
1,632
Sq Ft
$240/Sq Ft
Est. Value
About This Home
This home is located at 16 Duff Dr, Enfield, CT 06082 and is currently estimated at $391,770, approximately $240 per square foot. 16 Duff Dr is a home located in Hartford County with nearby schools including Edgar H. Parkman School, Enfield Street Elementary School, and Enfield High School.
Ownership History
Date
Name
Owned For
Owner Type
Purchase Details
Closed on
Feb 29, 2008
Sold by
Foster Patricia
Bought by
Kaiser Susan
Current Estimated Value
Home Financials for this Owner
Home Financials are based on the most recent Mortgage that was taken out on this home.
Original Mortgage
$236,300
Outstanding Balance
$147,685
Interest Rate
5.8%
Estimated Equity
$244,085
Purchase Details
Closed on
Mar 15, 2005
Sold by
Rancourt David and Rancourt Jennifer
Bought by
Grainger Ben
Home Financials for this Owner
Home Financials are based on the most recent Mortgage that was taken out on this home.
Original Mortgage
$201,600
Interest Rate
5.64%
Purchase Details
Closed on
Aug 25, 1999
Sold by
Ri Waterman Prop
Bought by
Rancourt David and Rancourt Jennifer
Home Financials for this Owner
Home Financials are based on the most recent Mortgage that was taken out on this home.
Original Mortgage
$138,855
Interest Rate
2.88%
Create a Home Valuation Report for This Property
The Home Valuation Report is an in-depth analysis detailing your home's value as well as a comparison with similar homes in the area
Home Values in the Area
Average Home Value in this Area
Purchase History
| Date | Buyer | Sale Price | Title Company |
|---|---|---|---|
| Kaiser Susan | $248,800 | -- | |
| Grainger Ben | $252,000 | -- | |
| Rancourt David | $140,000 | -- |
Source: Public Records
Mortgage History
| Date | Status | Borrower | Loan Amount |
|---|---|---|---|
| Open | Rancourt David | $236,300 | |
| Previous Owner | Rancourt David | $201,600 | |
| Previous Owner | Rancourt David | $37,800 | |
| Previous Owner | Rancourt David | $138,855 |
Source: Public Records
Tax History
| Year | Tax Paid | Tax Assessment Tax Assessment Total Assessment is a certain percentage of the fair market value that is determined by local assessors to be the total taxable value of land and additions on the property. | Land | Improvement |
|---|---|---|---|---|
| 2025 | $6,529 | $186,600 | $68,100 | $118,500 |
| 2024 | $6,354 | $186,600 | $68,100 | $118,500 |
| 2023 | $6,307 | $186,600 | $68,100 | $118,500 |
| 2022 | $5,727 | $186,600 | $68,100 | $118,500 |
| 2021 | $5,626 | $149,900 | $56,550 | $93,350 |
| 2020 | $5,626 | $149,900 | $56,550 | $93,350 |
| 2019 | $5,641 | $149,900 | $56,550 | $93,350 |
| 2018 | $5,546 | $149,900 | $56,550 | $93,350 |
| 2017 | $5,236 | $149,900 | $56,550 | $93,350 |
| 2016 | $5,117 | $149,150 | $58,020 | $91,130 |
| 2015 | $2,816 | $149,150 | $58,020 | $91,130 |
| 2014 | $4,829 | $149,150 | $58,020 | $91,130 |
Source: Public Records
Map
Nearby Homes
Your Personal Tour Guide
Ask me questions while you tour the home.