Estimated Value: $182,934 - $230,000
2
Beds
1
Bath
1,084
Sq Ft
$190/Sq Ft
Est. Value
About This Home
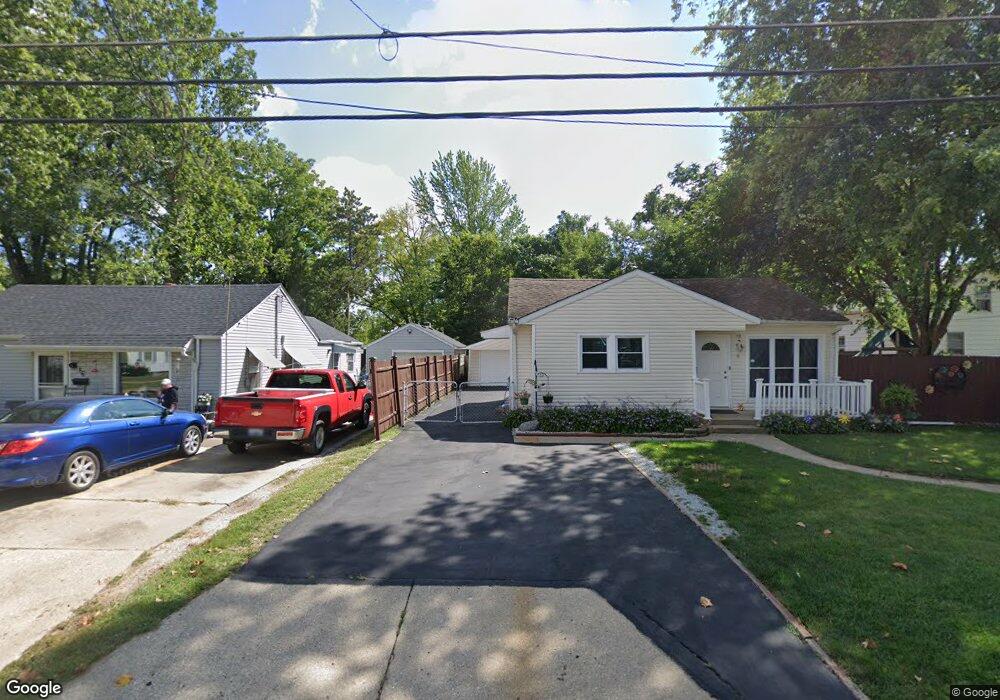
This home is located at 16 E Rock St, Plano, IL 60545 and is currently estimated at $206,234, approximately $190 per square foot. 16 E Rock St is a home located in Kendall County with nearby schools including P.H. Miller Elementary School, Centennial Elementary School, and Emily G. Johns School.
Ownership History
Date
Name
Owned For
Owner Type
Purchase Details
Closed on
Nov 29, 2010
Sold by
Barto John K
Bought by
Barto John S
Current Estimated Value
Home Financials for this Owner
Home Financials are based on the most recent Mortgage that was taken out on this home.
Original Mortgage
$41,450
Outstanding Balance
$27,343
Interest Rate
4.19%
Mortgage Type
New Conventional
Estimated Equity
$178,891
Purchase Details
Closed on
Mar 15, 2001
Sold by
Barto John S
Bought by
Barto John and Barto Marie
Home Financials for this Owner
Home Financials are based on the most recent Mortgage that was taken out on this home.
Original Mortgage
$55,000
Interest Rate
6.61%
Purchase Details
Closed on
Dec 8, 1998
Sold by
Barto John K and Barto Marie B
Bought by
Barto John K and Barto Marie B
Purchase Details
Closed on
Apr 1, 1996
Bought by
Barto Marie B and Barto John
Create a Home Valuation Report for This Property
The Home Valuation Report is an in-depth analysis detailing your home's value as well as a comparison with similar homes in the area
Home Values in the Area
Average Home Value in this Area
Purchase History
| Date | Buyer | Sale Price | Title Company |
|---|---|---|---|
| Barto John S | $40,000 | Chicago Title Insurance Co | |
| Barto John | -- | Lawyers Title Pick Up | |
| Barto John K | -- | -- | |
| Barto Marie B | $75,000 | -- |
Source: Public Records
Mortgage History
| Date | Status | Borrower | Loan Amount |
|---|---|---|---|
| Open | Barto John S | $41,450 | |
| Previous Owner | Barto John | $55,000 | |
| Closed | Barto Marie B | -- |
Source: Public Records
Tax History
| Year | Tax Paid | Tax Assessment Tax Assessment Total Assessment is a certain percentage of the fair market value that is determined by local assessors to be the total taxable value of land and additions on the property. | Land | Improvement |
|---|---|---|---|---|
| 2024 | $3,124 | $45,971 | $9,377 | $36,594 |
| 2023 | $2,746 | $40,888 | $8,340 | $32,548 |
| 2022 | $2,746 | $37,307 | $7,610 | $29,697 |
| 2021 | $2,564 | $35,001 | $7,140 | $27,861 |
| 2020 | $2,758 | $36,184 | $7,000 | $29,184 |
| 2019 | $2,906 | $35,045 | $6,711 | $28,334 |
| 2018 | $2,882 | $33,376 | $6,391 | $26,985 |
| 2017 | $2,816 | $30,923 | $6,391 | $24,532 |
| 2016 | $3,479 | $33,859 | $6,391 | $27,468 |
| 2015 | $1,624 | $28,778 | $5,500 | $23,278 |
| 2014 | -- | $26,368 | $5,200 | $21,168 |
| 2013 | -- | $26,746 | $6,578 | $20,168 |
Source: Public Records
Map
Nearby Homes
- 519 S Center St
- 17 W Dearborn St
- 618 S Bill St
- 18 W South St
- 317 E Dearborn St
- 309 W School St
- Lot 1 Blk 12 W John St
- 321 E Main St
- 217 N Hugh St
- 206 W South St
- 00 Lakewood Springs 7a
- 514 E Park St
- 210 E Edgelawn Dr
- 508 Ramsden Rd
- 1013 Daniel St
- 308 Alyssa St
- 2913 Alyssa St
- 934 Derby Dr
- 3011 Hoffman St
- 1019 Freeman St
Your Personal Tour Guide
Ask me questions while you tour the home.