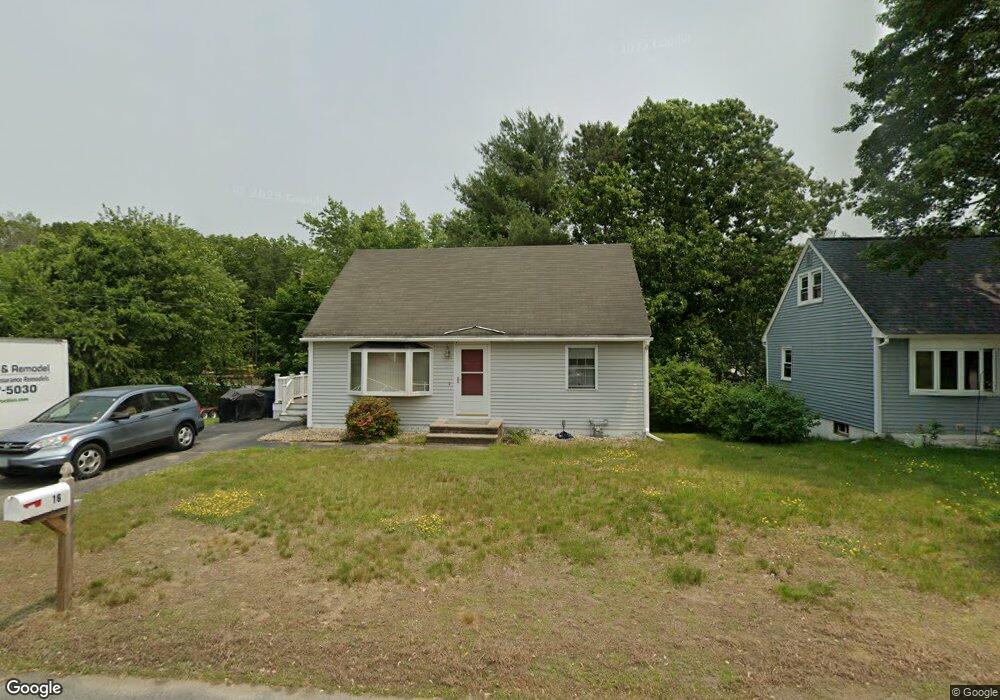
16 Elgin St Nashua, NH 03060
Southeast Nashua NeighborhoodEstimated Value: $483,000 - $529,000
4
Beds
2
Baths
1,114
Sq Ft
$452/Sq Ft
Est. Value
About This Home
This home is located at 16 Elgin St, Nashua, NH 03060 and is currently estimated at $503,469, approximately $451 per square foot. 16 Elgin St is a home located in Hillsborough County with nearby schools including Sunset Heights Elementary School, Elm Street Middle School, and Nashua High School South.
Ownership History
Date
Name
Owned For
Owner Type
Purchase Details
Closed on
Sep 3, 2003
Sold by
Raymond Arthur G and Raymond Patricia I
Bought by
Katsiaficas Mark R and Katsiaficas John J
Current Estimated Value
Home Financials for this Owner
Home Financials are based on the most recent Mortgage that was taken out on this home.
Original Mortgage
$98,000
Interest Rate
6.02%
Mortgage Type
Purchase Money Mortgage
Purchase Details
Closed on
Mar 12, 1999
Sold by
Raymond Arthur G and Raymond Patricia I
Bought by
Pam Rt
Create a Home Valuation Report for This Property
The Home Valuation Report is an in-depth analysis detailing your home's value as well as a comparison with similar homes in the area
Home Values in the Area
Average Home Value in this Area
Purchase History
| Date | Buyer | Sale Price | Title Company |
|---|---|---|---|
| Katsiaficas Mark R | $178,000 | -- | |
| Pam Rt | $30,000 | -- |
Source: Public Records
Mortgage History
| Date | Status | Borrower | Loan Amount |
|---|---|---|---|
| Open | Pam Rt | $381,000 | |
| Closed | Pam Rt | $142,961 | |
| Closed | Pam Rt | $98,000 |
Source: Public Records
Tax History Compared to Growth
Tax History
| Year | Tax Paid | Tax Assessment Tax Assessment Total Assessment is a certain percentage of the fair market value that is determined by local assessors to be the total taxable value of land and additions on the property. | Land | Improvement |
|---|---|---|---|---|
| 2024 | $6,397 | $402,300 | $156,000 | $246,300 |
| 2023 | $6,010 | $329,700 | $124,800 | $204,900 |
| 2022 | $5,958 | $329,700 | $124,800 | $204,900 |
| 2021 | $5,466 | $235,400 | $87,400 | $148,000 |
| 2020 | $5,304 | $234,600 | $87,400 | $147,200 |
| 2019 | $5,105 | $234,600 | $87,400 | $147,200 |
| 2018 | $4,976 | $234,600 | $87,400 | $147,200 |
| 2017 | $4,444 | $172,300 | $75,100 | $97,200 |
| 2016 | $4,320 | $172,300 | $75,100 | $97,200 |
| 2015 | $4,227 | $172,300 | $75,100 | $97,200 |
| 2014 | $4,144 | $172,300 | $75,100 | $97,200 |
Source: Public Records
Map
Nearby Homes
- 130 E Hobart St Unit 85
- 160 Daniel Webster Hwy Unit 328
- 7 Hickory St
- 61 Spindlewick Dr
- 4 Autumn Leaf Dr Unit 8
- 36 Eastman St Unit 26
- 73 Bluestone Dr
- 92 Bluestone Dr
- 5 Louisburg Square Unit 11
- 15 Learned St Unit 123
- 27 Fifield St Unit 13
- 6 Hayden St
- 9 Byron Dr
- 17 Herrick St
- 10 Cedar St
- 1 Circle Ave
- 125 Lille Rd
- 55 Glen Dr
- 65 Allds St
- 2 Lyons St
- 18 Elgin St
- 131 Linton St Unit 227
- 118 E Glenwood St Unit 159
- 128 Linton St Unit 229
- 127 Linton St
- 116 E Glenwood St
- 123 Linton St
- 124 Linton St Unit 231
- 119 E Glenwood St
- 114 E Glenwood St Unit 161
- 21 Westbrook Dr
- 117 E Glenwood St Unit 156
- 115 E Glenwood St Unit 154
- 24 Elgin St
- 119 Linton St Unit 223
- 120 Linton St Unit 233
- 112 E Glenwood St Unit 163
- 26 Elgin St
- 19 Westbrook Dr
- 115 Linton St