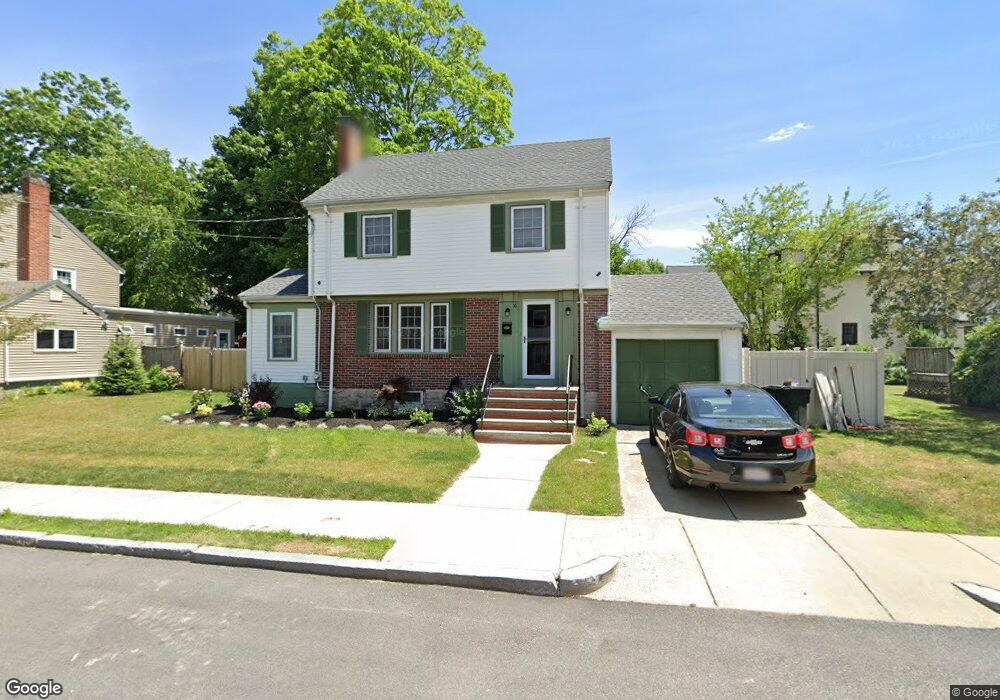
16 Ferncroft Rd West Roxbury, MA 02132
West Roxbury NeighborhoodEstimated Value: $849,000 - $976,000
3
Beds
2
Baths
1,325
Sq Ft
$674/Sq Ft
Est. Value
About This Home
This home is located at 16 Ferncroft Rd, West Roxbury, MA 02132 and is currently estimated at $893,222, approximately $674 per square foot. 16 Ferncroft Rd is a home located in Suffolk County with nearby schools including Holy Name Parish School, St Theresa School, and The Roxbury Latin School.
Ownership History
Date
Name
Owned For
Owner Type
Purchase Details
Closed on
Sep 21, 2018
Sold by
Stryer Ellen B and Macchi Caroline B
Bought by
Mcclure Douglas
Current Estimated Value
Home Financials for this Owner
Home Financials are based on the most recent Mortgage that was taken out on this home.
Original Mortgage
$560,000
Outstanding Balance
$487,347
Interest Rate
4.5%
Mortgage Type
New Conventional
Estimated Equity
$405,875
Create a Home Valuation Report for This Property
The Home Valuation Report is an in-depth analysis detailing your home's value as well as a comparison with similar homes in the area
Home Values in the Area
Average Home Value in this Area
Purchase History
| Date | Buyer | Sale Price | Title Company |
|---|---|---|---|
| Mcclure Douglas | $500,000 | -- |
Source: Public Records
Mortgage History
| Date | Status | Borrower | Loan Amount |
|---|---|---|---|
| Open | Mcclure Douglas | $560,000 |
Source: Public Records
Tax History Compared to Growth
Tax History
| Year | Tax Paid | Tax Assessment Tax Assessment Total Assessment is a certain percentage of the fair market value that is determined by local assessors to be the total taxable value of land and additions on the property. | Land | Improvement |
|---|---|---|---|---|
| 2025 | $8,712 | $752,300 | $294,000 | $458,300 |
| 2024 | $7,530 | $690,800 | $263,200 | $427,600 |
| 2023 | $7,202 | $670,600 | $255,500 | $415,100 |
| 2022 | $6,632 | $609,600 | $232,300 | $377,300 |
| 2021 | $6,078 | $569,600 | $221,200 | $348,400 |
| 2020 | $5,457 | $516,800 | $206,300 | $310,500 |
| 2019 | $5,235 | $496,700 | $168,900 | $327,800 |
| 2018 | $4,821 | $460,000 | $168,900 | $291,100 |
| 2017 | $4,774 | $450,800 | $168,900 | $281,900 |
| 2016 | $4,591 | $417,400 | $168,900 | $248,500 |
| 2015 | $4,873 | $402,400 | $173,900 | $228,500 |
| 2014 | $4,777 | $379,700 | $173,900 | $205,800 |
Source: Public Records
Map
Nearby Homes
- 37 Pomfret St
- 19 Pomfret St
- 37 Hastings St Unit 103
- 168 Maple St
- 76 Vermont St
- 76 Potomac St
- 1789 Centre St Unit 202
- 110 Park St Unit 3
- 55 Redlands Rd
- 539 Lagrange St
- 22 Bellevue St
- 701 Vfw Pkwy
- 9 Carroll St
- 416 Belgrade Ave Unit 25
- 10 Burwell Rd
- 183 Temple St
- 331 Vermont St
- 425 Lagrange St Unit 203
- 54 Sturges Rd
- 59 Chesbrough Rd