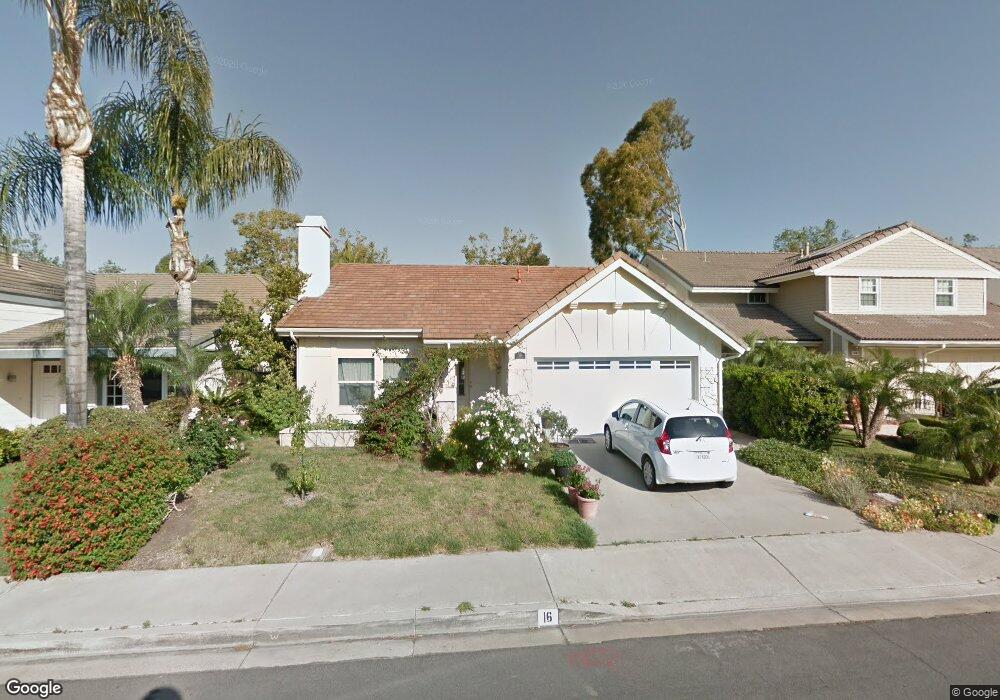
16 Jackson Irvine, CA 92620
Northwood NeighborhoodEstimated Value: $1,543,673 - $1,686,000
3
Beds
2
Baths
1,688
Sq Ft
$956/Sq Ft
Est. Value
About This Home
This home is located at 16 Jackson, Irvine, CA 92620 and is currently estimated at $1,614,168, approximately $956 per square foot. 16 Jackson is a home located in Orange County with nearby schools including Northwood Elementary School, Sierra Vista Middle School, and Northwood High School.
Ownership History
Date
Name
Owned For
Owner Type
Purchase Details
Closed on
Nov 12, 2021
Sold by
Weber Myron L
Bought by
Weber Myron L
Current Estimated Value
Home Financials for this Owner
Home Financials are based on the most recent Mortgage that was taken out on this home.
Original Mortgage
$407,000
Outstanding Balance
$372,945
Interest Rate
2.99%
Mortgage Type
New Conventional
Estimated Equity
$1,241,223
Purchase Details
Closed on
Nov 4, 2010
Sold by
Weber Myron L and Weber Laura T
Bought by
Weber Myron L
Home Financials for this Owner
Home Financials are based on the most recent Mortgage that was taken out on this home.
Original Mortgage
$417,000
Interest Rate
4.23%
Mortgage Type
New Conventional
Purchase Details
Closed on
Jul 13, 2009
Sold by
Gray Jillian Thach and Thach Jillian
Bought by
Weber Myron L and Weber Laura T
Home Financials for this Owner
Home Financials are based on the most recent Mortgage that was taken out on this home.
Original Mortgage
$417,000
Interest Rate
5.37%
Mortgage Type
Purchase Money Mortgage
Purchase Details
Closed on
Oct 29, 2007
Sold by
Thach Thien and Thach Jillian
Bought by
Thach Jillian
Purchase Details
Closed on
Apr 1, 2005
Sold by
Makenen Robert and Reinus Lori
Bought by
Thach Thien and Thach Jillian
Home Financials for this Owner
Home Financials are based on the most recent Mortgage that was taken out on this home.
Original Mortgage
$568,000
Interest Rate
6.02%
Mortgage Type
Fannie Mae Freddie Mac
Purchase Details
Closed on
Jul 30, 1993
Sold by
Makenen Arnie J and Makenen Hazel M
Bought by
Makenen Arnie J and Makenen Hazel M
Home Financials for this Owner
Home Financials are based on the most recent Mortgage that was taken out on this home.
Original Mortgage
$63,000
Interest Rate
7.34%
Purchase Details
Closed on
Jun 2, 1993
Sold by
Makenen Arnie J and Makenen Hazel M
Bought by
Makenen Arnie J and Makenen Hazel M
Home Financials for this Owner
Home Financials are based on the most recent Mortgage that was taken out on this home.
Original Mortgage
$63,000
Interest Rate
7.34%
Create a Home Valuation Report for This Property
The Home Valuation Report is an in-depth analysis detailing your home's value as well as a comparison with similar homes in the area
Home Values in the Area
Average Home Value in this Area
Purchase History
| Date | Buyer | Sale Price | Title Company |
|---|---|---|---|
| Weber Myron L | -- | Stewart Title Guaranty Co | |
| Weber Myron L | -- | Fidelity National Title Co | |
| Weber Myron L | $625,000 | Lawyers Title Co | |
| Thach Jillian | -- | None Available | |
| Thach Thien | $710,000 | Ticor Title Company | |
| Makenen Arnie J | -- | -- | |
| Makenen Arnie J | -- | Orange Coast Title Company |
Source: Public Records
Mortgage History
| Date | Status | Borrower | Loan Amount |
|---|---|---|---|
| Open | Weber Myron L | $407,000 | |
| Closed | Weber Myron L | $417,000 | |
| Closed | Weber Myron L | $417,000 | |
| Previous Owner | Thach Thien | $568,000 | |
| Previous Owner | Makenen Arnie J | $63,000 |
Source: Public Records
Tax History
| Year | Tax Paid | Tax Assessment Tax Assessment Total Assessment is a certain percentage of the fair market value that is determined by local assessors to be the total taxable value of land and additions on the property. | Land | Improvement |
|---|---|---|---|---|
| 2025 | $8,403 | $806,759 | $632,283 | $174,476 |
| 2024 | $8,403 | $790,941 | $619,886 | $171,055 |
| 2023 | $8,187 | $775,433 | $607,732 | $167,701 |
| 2022 | $8,032 | $760,229 | $595,816 | $164,413 |
| 2021 | $7,777 | $745,323 | $584,133 | $161,190 |
| 2020 | $7,733 | $737,681 | $578,143 | $159,538 |
| 2019 | $7,561 | $723,217 | $566,807 | $156,410 |
| 2018 | $7,427 | $709,037 | $555,693 | $153,344 |
| 2017 | $7,273 | $695,135 | $544,797 | $150,338 |
| 2016 | $6,949 | $681,505 | $534,114 | $147,391 |
| 2015 | $6,844 | $671,269 | $526,091 | $145,178 |
| 2014 | $6,711 | $658,120 | $515,785 | $142,335 |
Source: Public Records
Map
Nearby Homes
- 4 Carson
- 6 Gettysburg
- 30 Jefferson
- 22 Yorktown
- 66 Bridgeport
- 18 Harrisburg
- 22 Hunter
- 4061 Salacia Dr
- 7 Chattanooga
- 65 Remington Unit 232
- 4062 Escudero Dr
- 30 Remington
- 39 Cape Cod
- 10 Prescott
- 306 Streamwood
- 27 Torrey Pine
- 84 Jade Flower
- 73 Huntington Unit 322
- 229 Springview Unit 229
- 83 Huntington Unit 278
Your Personal Tour Guide
Ask me questions while you tour the home.