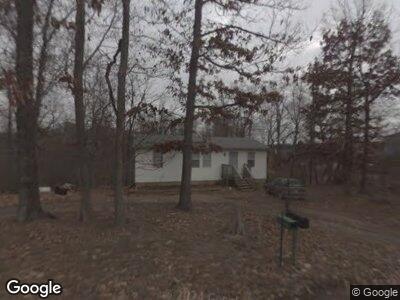
16 Joe Ball Rd Chuckey, TN 37641
Estimated Value: $163,606 - $197,000
--
Bed
1
Bath
800
Sq Ft
$231/Sq Ft
Est. Value
About This Home
This home is located at 16 Joe Ball Rd, Chuckey, TN 37641 and is currently estimated at $184,902, approximately $231 per square foot. 16 Joe Ball Rd is a home located in Greene County with nearby schools including Doak Elementary School, Chuckey Doak Middle School, and Chuckey Doak High School.
Ownership History
Date
Name
Owned For
Owner Type
Purchase Details
Closed on
Dec 31, 2019
Sold by
Barwick William Francis and Barwick Beverly Addeen
Bought by
Cobble Jeffrey A
Current Estimated Value
Home Financials for this Owner
Home Financials are based on the most recent Mortgage that was taken out on this home.
Original Mortgage
$89,250
Outstanding Balance
$79,836
Interest Rate
3.7%
Mortgage Type
Commercial
Estimated Equity
$115,980
Purchase Details
Closed on
Dec 10, 2012
Sold by
Barwick William Francis
Bought by
Barwick Beverly Addeen
Purchase Details
Closed on
Apr 29, 2005
Sold by
Barwick Francis Lynette
Bought by
Barwick William Francis
Purchase Details
Closed on
Jun 12, 1998
Sold by
Ball Lois L and Ball E
Bought by
Barwick William
Purchase Details
Closed on
Feb 26, 1993
Create a Home Valuation Report for This Property
The Home Valuation Report is an in-depth analysis detailing your home's value as well as a comparison with similar homes in the area
Home Values in the Area
Average Home Value in this Area
Purchase History
| Date | Buyer | Sale Price | Title Company |
|---|---|---|---|
| Cobble Jeffrey A | $105,000 | None Available | |
| Barwick Beverly Addeen | -- | -- | |
| Barwick William Francis | -- | -- | |
| Barwick William | $17,000 | -- | |
| -- | $5,500 | -- |
Source: Public Records
Mortgage History
| Date | Status | Borrower | Loan Amount |
|---|---|---|---|
| Open | Cobble Jeffrey A | $89,250 | |
| Previous Owner | Francis Barwick William | $56,000 | |
| Previous Owner | Barwick William F | $31,192 | |
| Previous Owner | Wiliam Barwick | $49,436 |
Source: Public Records
Tax History Compared to Growth
Tax History
| Year | Tax Paid | Tax Assessment Tax Assessment Total Assessment is a certain percentage of the fair market value that is determined by local assessors to be the total taxable value of land and additions on the property. | Land | Improvement |
|---|---|---|---|---|
| 2024 | $568 | $34,400 | $12,925 | $21,475 |
| 2023 | $635 | $34,400 | $0 | $0 |
| 2022 | $37,200 | $18,450 | $9,000 | $9,450 |
| 2021 | $372 | $18,450 | $9,000 | $9,450 |
| 2020 | $379 | $18,450 | $9,000 | $9,450 |
| 2019 | $379 | $18,825 | $9,375 | $9,450 |
| 2018 | $379 | $18,825 | $9,375 | $9,450 |
| 2017 | $371 | $18,825 | $9,425 | $9,400 |
| 2016 | $353 | $18,825 | $9,425 | $9,400 |
| 2015 | $353 | $18,825 | $9,425 | $9,400 |
| 2014 | $353 | $18,825 | $9,425 | $9,400 |
Source: Public Records
Map
Nearby Homes
- 4773&4775 Rheatown Rd
- Tbd Rheatown Rd
- 8185 Kingsport Hwy
- 6245 Snapps Ferry Rd
- 463 Pine Ridge Dr
- 330 Robertson Rd
- 00 Kingsport Hwy
- 655 Old Snapps Ferry Rd
- 50 Idell Cir
- Lot 13 Rheatown Rd
- 0 Rheatown Rd
- 225 Mary Lamons Rd
- 1760 Babbs Mill Rd
- 1335 Old Snapps Ferry Rd
- 850 Quaker Knob Rd
- 2020 Doty Chapel Rd
- Lot 26 Babbs Mill Rd
- 1836 Stone Dam Rd
- Tbd Rock Quarry Rd
- 71 Wandering Dr
- 16 Joe Ball Rd
- 500 Teague Rd
- 710 Teague Rd
- Lots 5-8 Teague Rd
- Lots 1-3 Teague Rd
- 0 Teague Rd
- Lot 3 Teague Rd
- Lot 2 Teague Rd
- Lot 1 Teague Rd
- 204 Joe Ball Rd
- 440 Walkertown Rd
- 440 Walkertown Rd Unit 1
- 440 Teague Rd
- 690 Walkertown Rd
- 0 Walkertown Rd
- 398 Teague Rd
- 380 Joe Ball Rd
- 275 Teague Rd
- 224 Joe Ball Rd
- 735 Walkertown Rd