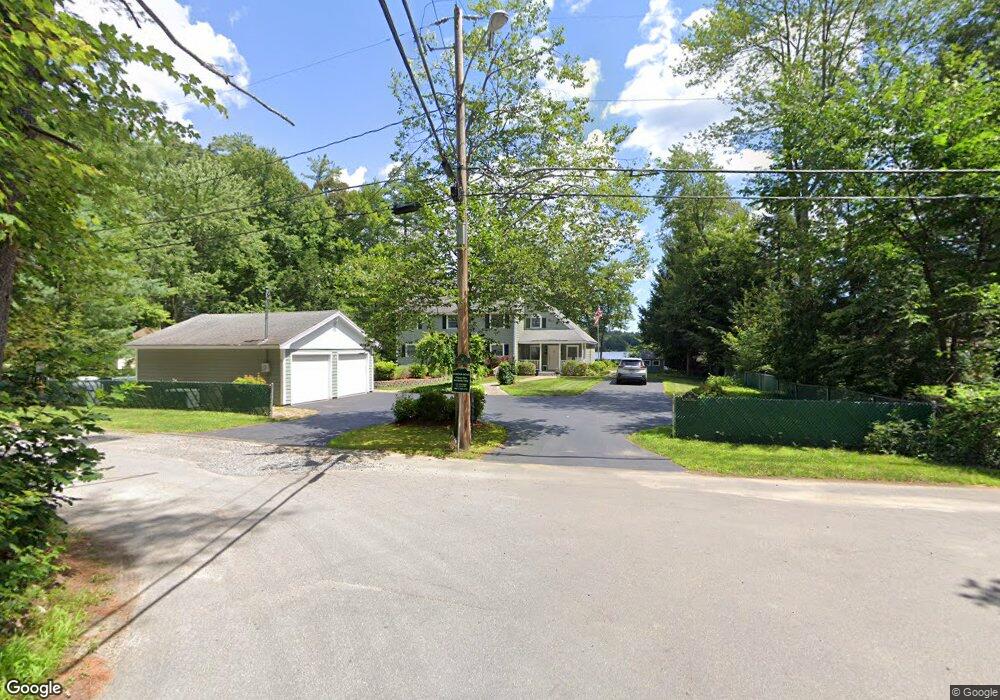
16 Jordan Rd Windham, NH 03087
Estimated Value: $794,370 - $919,000
3
Beds
3
Baths
2,666
Sq Ft
$331/Sq Ft
Est. Value
About This Home
This home is located at 16 Jordan Rd, Windham, NH 03087 and is currently estimated at $882,093, approximately $330 per square foot. 16 Jordan Rd is a home located in Rockingham County with nearby schools including Golden Brook Elementary School, Windham Middle School, and Windham High School.
Ownership History
Date
Name
Owned For
Owner Type
Purchase Details
Closed on
Sep 26, 2008
Sold by
Oneill Timothy F and Oneill Marie D
Bought by
Daigle Edward R and Daigle Gay E
Current Estimated Value
Home Financials for this Owner
Home Financials are based on the most recent Mortgage that was taken out on this home.
Original Mortgage
$150,000
Outstanding Balance
$100,415
Interest Rate
6.57%
Estimated Equity
$781,678
Purchase Details
Closed on
Sep 30, 1998
Sold by
Corriveau Ernest R and Corriveau Margaret E
Bought by
Oneill Timothy F and Oneill Marie D
Home Financials for this Owner
Home Financials are based on the most recent Mortgage that was taken out on this home.
Original Mortgage
$148,500
Interest Rate
6.89%
Create a Home Valuation Report for This Property
The Home Valuation Report is an in-depth analysis detailing your home's value as well as a comparison with similar homes in the area
Home Values in the Area
Average Home Value in this Area
Purchase History
| Date | Buyer | Sale Price | Title Company |
|---|---|---|---|
| Daigle Edward R | $450,000 | -- | |
| Oneill Timothy F | $165,000 | -- |
Source: Public Records
Mortgage History
| Date | Status | Borrower | Loan Amount |
|---|---|---|---|
| Open | Oneill Timothy F | $150,000 | |
| Previous Owner | Oneill Timothy F | $148,500 |
Source: Public Records
Tax History
| Year | Tax Paid | Tax Assessment Tax Assessment Total Assessment is a certain percentage of the fair market value that is determined by local assessors to be the total taxable value of land and additions on the property. | Land | Improvement |
|---|---|---|---|---|
| 2024 | $11,445 | $505,500 | $210,100 | $295,400 |
| 2023 | $10,818 | $505,500 | $210,100 | $295,400 |
| 2022 | $9,811 | $496,500 | $210,100 | $286,400 |
| 2021 | $9,245 | $496,500 | $210,100 | $286,400 |
| 2020 | $9,498 | $496,500 | $210,100 | $286,400 |
| 2019 | $8,542 | $378,800 | $138,500 | $240,300 |
| 2018 | $8,822 | $378,800 | $138,500 | $240,300 |
| 2017 | $7,652 | $378,800 | $138,500 | $240,300 |
| 2016 | $8,265 | $378,800 | $138,500 | $240,300 |
| 2015 | $8,188 | $377,000 | $138,500 | $238,500 |
| 2014 | $9,108 | $379,500 | $194,000 | $185,500 |
| 2013 | $9,154 | $387,900 | $194,000 | $193,900 |
Source: Public Records
Map
Nearby Homes
- 48 Marblehead Rd
- 210 Range Rd
- 47 Cobbetts Pond Rd
- 23 Ryan Farm Rd
- 47 Campbell St
- 1102 Mammoth Rd Unit A&B
- 30 Winter St
- 56 Nelson St
- 18 Winter St
- 2 Cypress Ln
- 7 Cypress Ln Unit 5
- 4 Cypress Ln Unit 10
- 4 Rosemary St
- 6 Hemlock Dr
- 1109 Mammoth Rd Unit A
- 6-18 Mary Anthony Dr
- 11 Venus Way
- 7 Venus Way Unit 22
- 11 Wellesley Dr
- Lot 4 Canterbury Rd Unit 4
Your Personal Tour Guide
Ask me questions while you tour the home.