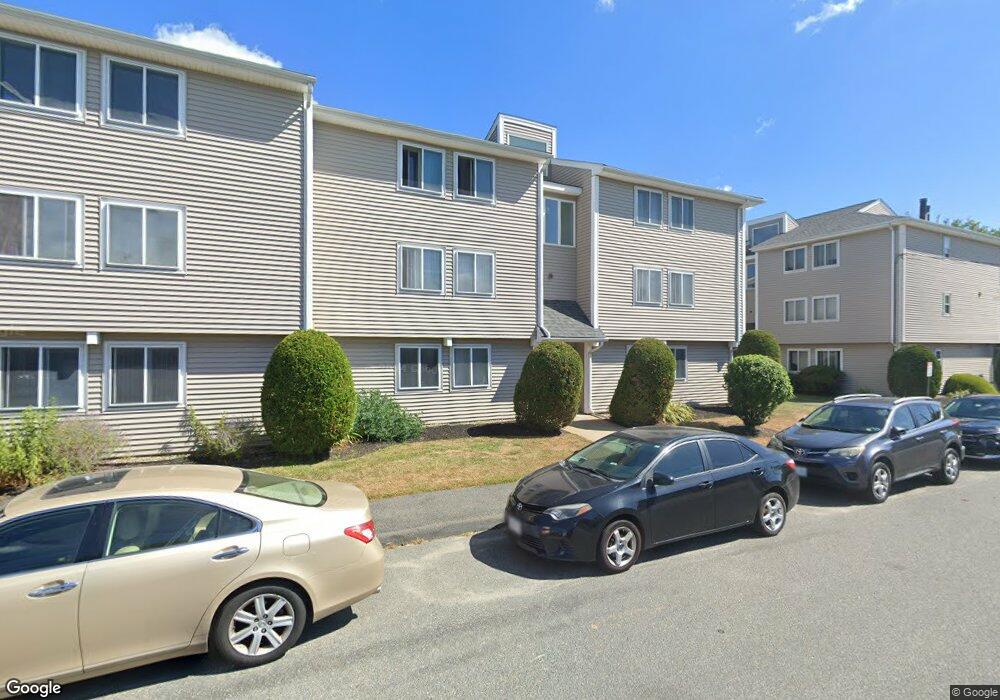
16 Leverett Ave Unit 12 Boston, MA 02128
Harbor View-Orient Heights NeighborhoodEstimated Value: $393,000 - $597,000
2
Beds
2
Baths
1,014
Sq Ft
$496/Sq Ft
Est. Value
About This Home
This home is located at 16 Leverett Ave Unit 12, Boston, MA 02128 and is currently estimated at $502,701, approximately $495 per square foot. 16 Leverett Ave Unit 12 is a home located in Suffolk County with nearby schools including Excel Academy East Boston, East Boston Montessori School, and Brooke Charter Schools East Boston.
Ownership History
Date
Name
Owned For
Owner Type
Purchase Details
Closed on
Feb 20, 2024
Sold by
Troyer Pamela J
Bought by
Pjt Rt and Troyer
Current Estimated Value
Purchase Details
Closed on
Oct 1, 1999
Sold by
Desousa Noemia L and Deverseaux Sheila M
Bought by
Grant Thomas C and Devereaux Sheila M
Home Financials for this Owner
Home Financials are based on the most recent Mortgage that was taken out on this home.
Original Mortgage
$82,700
Interest Rate
7.85%
Mortgage Type
Purchase Money Mortgage
Purchase Details
Closed on
Aug 15, 1997
Sold by
Milito Deborah M
Bought by
Desousa Noemia L
Home Financials for this Owner
Home Financials are based on the most recent Mortgage that was taken out on this home.
Original Mortgage
$52,000
Interest Rate
7.56%
Mortgage Type
Purchase Money Mortgage
Purchase Details
Closed on
Oct 20, 1993
Sold by
Oeser Russell R
Bought by
Milito Deborah M
Home Financials for this Owner
Home Financials are based on the most recent Mortgage that was taken out on this home.
Original Mortgage
$51,300
Interest Rate
6.73%
Mortgage Type
Purchase Money Mortgage
Create a Home Valuation Report for This Property
The Home Valuation Report is an in-depth analysis detailing your home's value as well as a comparison with similar homes in the area
Home Values in the Area
Average Home Value in this Area
Purchase History
| Date | Buyer | Sale Price | Title Company |
|---|---|---|---|
| Pjt Rt | -- | None Available | |
| Grant Thomas C | $95,000 | -- | |
| Grant Thomas C | $95,000 | -- | |
| Desousa Noemia L | $65,000 | -- | |
| Milito Deborah M | $57,000 | -- | |
| Milito Deborah M | $57,000 | -- |
Source: Public Records
Mortgage History
| Date | Status | Borrower | Loan Amount |
|---|---|---|---|
| Previous Owner | Grant Thomas C | $82,700 | |
| Previous Owner | Desousa Noemia L | $52,000 | |
| Previous Owner | Milito Deborah M | $51,300 |
Source: Public Records
Tax History Compared to Growth
Tax History
| Year | Tax Paid | Tax Assessment Tax Assessment Total Assessment is a certain percentage of the fair market value that is determined by local assessors to be the total taxable value of land and additions on the property. | Land | Improvement |
|---|---|---|---|---|
| 2025 | $4,750 | $410,200 | $0 | $410,200 |
| 2024 | $4,489 | $411,800 | $0 | $411,800 |
| 2023 | $4,377 | $407,500 | $0 | $407,500 |
| 2022 | $4,304 | $395,600 | $0 | $395,600 |
| 2021 | $4,170 | $390,800 | $0 | $390,800 |
| 2020 | $3,438 | $325,600 | $0 | $325,600 |
| 2019 | $3,272 | $310,400 | $0 | $310,400 |
| 2018 | $2,989 | $285,200 | $0 | $285,200 |
| 2017 | $2,746 | $259,300 | $0 | $259,300 |
| 2016 | $2,746 | $249,600 | $0 | $249,600 |
| 2015 | $2,699 | $222,900 | $0 | $222,900 |
| 2014 | $2,656 | $211,100 | $0 | $211,100 |
Source: Public Records
Map
Nearby Homes
- 1203 Bennington St
- 49 Faywood Ave
- 92 Waldemar Ave
- 77 Bennington St Unit 406
- 5 Nancia St Unit 2
- 56 Main St
- 20 Nancia St
- 1044 Saratoga St Unit 1
- 14 Pleasant Park Rd
- 19 Pleasant Park Rd
- 29 St Andrew Rd Unit 1
- 1030 Bennington St Unit 15
- 94 Crescent Ave
- 36A Leyden St
- 550 Pleasant St Unit 11D
- 550 Pleasant St Unit 506
- 31 Crest Ave
- 188 Gladstone St Unit 1
- 16 Boardman St Unit 105
- 50-52 Wilshire St
- 16 Leverett Ave Unit 11
- 16 Leverett Ave Unit 10
- 16 Leverett Ave Unit 9
- 16 Leverett Ave Unit 8
- 16 Leverett Ave Unit 7
- 16 Leverett Ave Unit 11A,16
- 16 Leverett Ave Unit 7A
- 18 Leverett Ave Unit 12
- 18 Leverett Ave Unit 11
- 18 Leverett Ave Unit 10
- 18 Leverett Ave Unit 9
- 18 Leverett Ave Unit 8
- 18 Leverett Ave Unit 7
- 14 Leverett Ave Unit 1A
- 14 Leverett Ave Unit 5
- 14 Leverett Ave Unit 4
- 14 Leverett Ave Unit 3
- 14 Leverett Ave Unit 2
- 14 Leverett Ave Unit 1
- 14 Leverett Ave