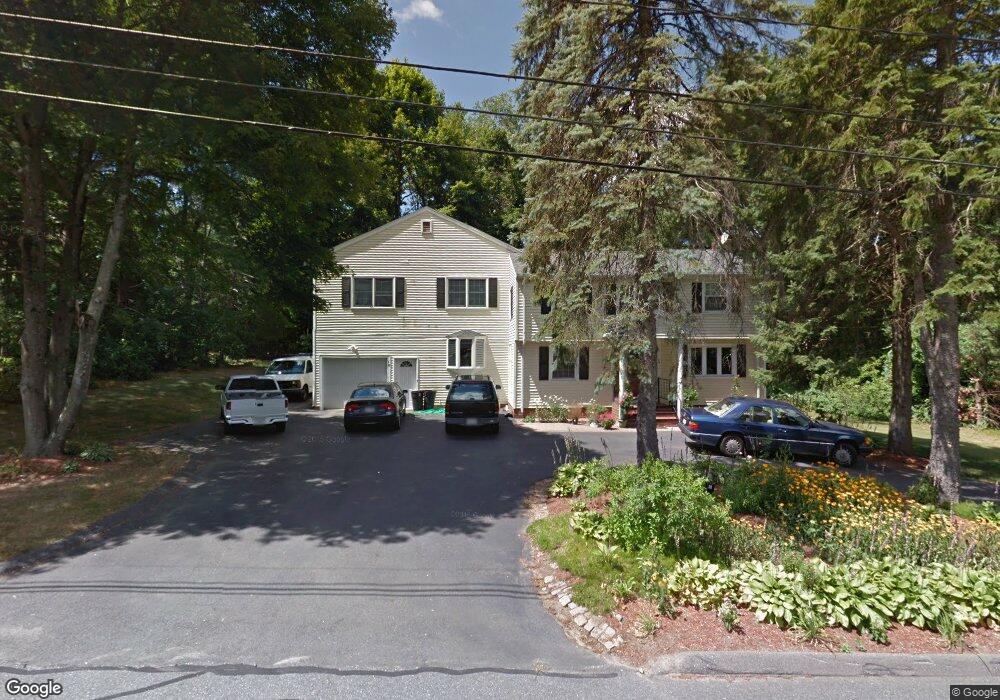
16 Oxbow Rd Unit 1 Lexington, MA 02421
North Lexington NeighborhoodEstimated Value: $1,592,322 - $1,765,000
2
Beds
1
Bath
920
Sq Ft
$1,846/Sq Ft
Est. Value
About This Home
This home is located at 16 Oxbow Rd Unit 1, Lexington, MA 02421 and is currently estimated at $1,698,581, approximately $1,846 per square foot. 16 Oxbow Rd Unit 1 is a home located in Middlesex County with nearby schools including Maria Hastings Elementary School, William Diamond Middle School, and Lexington High School.
Ownership History
Date
Name
Owned For
Owner Type
Purchase Details
Closed on
Oct 19, 2012
Sold by
Kirmani Maarij A
Bought by
Kirmani Maarij A and Kirmani Humaira K
Current Estimated Value
Purchase Details
Closed on
Jun 23, 1998
Sold by
Kirmani Samia M and Kirmani Meshal A
Bought by
Krimani Maarij A and Kirmani Humaira K
Purchase Details
Closed on
Oct 17, 1997
Sold by
Kirmani Minhaj
Bought by
Kirmani Samia M and Kirmani Meshal A
Create a Home Valuation Report for This Property
The Home Valuation Report is an in-depth analysis detailing your home's value as well as a comparison with similar homes in the area
Home Values in the Area
Average Home Value in this Area
Purchase History
| Date | Buyer | Sale Price | Title Company |
|---|---|---|---|
| Kirmani Maarij A | -- | -- | |
| Krimani Maarij A | $235,000 | -- | |
| Kirmani Samia M | $235,000 | -- |
Source: Public Records
Mortgage History
| Date | Status | Borrower | Loan Amount |
|---|---|---|---|
| Previous Owner | Kirmani Samia M | $402,750 | |
| Previous Owner | Kirmani Samia M | $52,000 |
Source: Public Records
Tax History Compared to Growth
Tax History
| Year | Tax Paid | Tax Assessment Tax Assessment Total Assessment is a certain percentage of the fair market value that is determined by local assessors to be the total taxable value of land and additions on the property. | Land | Improvement |
|---|---|---|---|---|
| 2025 | $16,474 | $1,347,000 | $638,000 | $709,000 |
| 2024 | $16,109 | $1,315,000 | $607,000 | $708,000 |
| 2023 | $15,821 | $1,217,000 | $552,000 | $665,000 |
| 2022 | $14,835 | $1,075,000 | $502,000 | $573,000 |
| 2021 | $3,570 | $1,003,000 | $478,000 | $525,000 |
| 2020 | $13,938 | $992,000 | $478,000 | $514,000 |
| 2019 | $13,372 | $947,000 | $455,000 | $492,000 |
| 2018 | $3,227 | $917,000 | $434,000 | $483,000 |
| 2017 | $3,151 | $882,000 | $400,000 | $482,000 |
| 2016 | $12,892 | $883,000 | $381,000 | $502,000 |
| 2015 | $12,423 | $836,000 | $346,000 | $490,000 |
| 2014 | $12,392 | $799,000 | $308,000 | $491,000 |
Source: Public Records
Map
Nearby Homes
- 6 Revolutionary Rd
- 30 Harbell St
- 46 Asbury St
- 18 Greenwood St
- 21 Balfour St
- 2520 Massachusetts Ave
- 2380 Massachusetts Ave
- 50 School St
- 24 Deering Ave
- 19 Deering Ave
- 7 Carmel Cir
- 671 Marrett Rd
- 5 Leroy Rd
- 24 Vaille Ave
- 231 Bedford St
- 93 Bedford St Unit 201
- 93 Bedford St Unit 308
- 93 Bedford St Unit 101
- 32 Forest St
- 1900 Massachusetts Ave