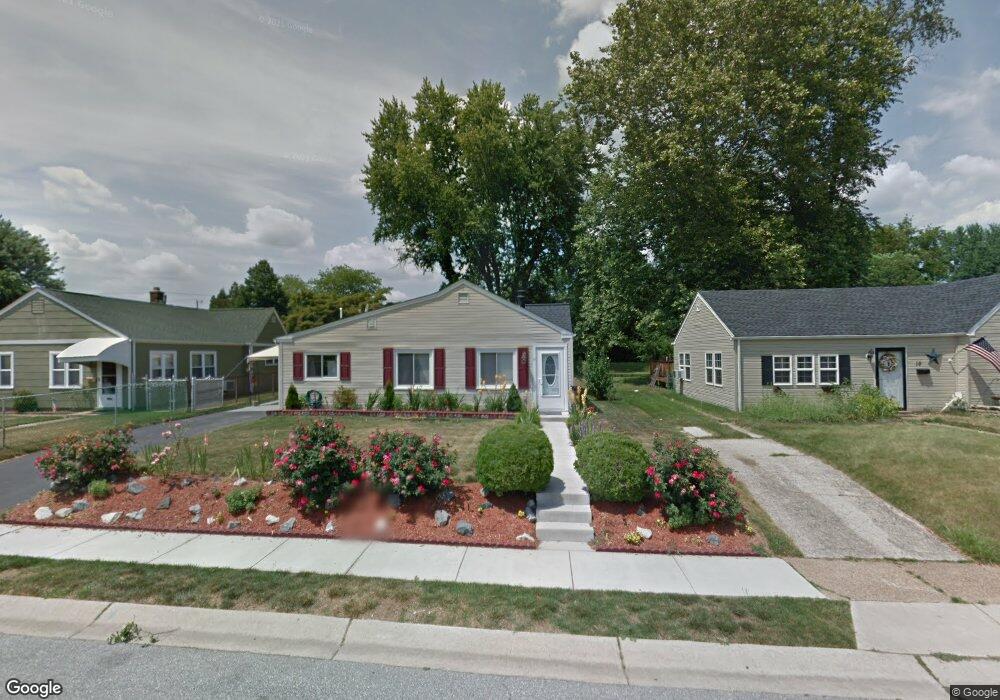
16 Oxford Ct Wilmington, DE 19805
Estimated Value: $275,000 - $294,000
3
Beds
1
Bath
1,225
Sq Ft
$230/Sq Ft
Est. Value
About This Home
This home is located at 16 Oxford Ct, Wilmington, DE 19805 and is currently estimated at $282,251, approximately $230 per square foot. 16 Oxford Ct is a home located in New Castle County with nearby schools including Austin D. Baltz Elementary School, Alexis I. du Pont Middle School, and Thomas McKean High School.
Ownership History
Date
Name
Owned For
Owner Type
Purchase Details
Closed on
Jul 25, 2008
Sold by
Bert Holdings Llc
Bought by
Luna Miguel
Current Estimated Value
Home Financials for this Owner
Home Financials are based on the most recent Mortgage that was taken out on this home.
Original Mortgage
$198,333
Outstanding Balance
$130,618
Interest Rate
6.4%
Mortgage Type
FHA
Estimated Equity
$151,633
Purchase Details
Closed on
Jan 24, 2008
Sold by
Zakreski Joseph T and Zakreski Steven T
Bought by
Bert Holdings Llc
Purchase Details
Closed on
Feb 13, 2002
Sold by
Zakreski Steven T and Craig Lori A
Bought by
Zakreski Steven T
Create a Home Valuation Report for This Property
The Home Valuation Report is an in-depth analysis detailing your home's value as well as a comparison with similar homes in the area
Home Values in the Area
Average Home Value in this Area
Purchase History
| Date | Buyer | Sale Price | Title Company |
|---|---|---|---|
| Luna Miguel | $199,900 | None Available | |
| Bert Holdings Llc | $135,000 | None Available | |
| Zakreski Steven T | -- | -- |
Source: Public Records
Mortgage History
| Date | Status | Borrower | Loan Amount |
|---|---|---|---|
| Open | Luna Miguel | $198,333 |
Source: Public Records
Tax History Compared to Growth
Tax History
| Year | Tax Paid | Tax Assessment Tax Assessment Total Assessment is a certain percentage of the fair market value that is determined by local assessors to be the total taxable value of land and additions on the property. | Land | Improvement |
|---|---|---|---|---|
| 2024 | $1,339 | $35,300 | $7,300 | $28,000 |
| 2023 | $1,185 | $35,300 | $7,300 | $28,000 |
| 2022 | $1,193 | $35,300 | $7,300 | $28,000 |
| 2021 | $1,192 | $35,300 | $7,300 | $28,000 |
| 2020 | $1,195 | $35,300 | $7,300 | $28,000 |
| 2019 | $1,514 | $35,300 | $7,300 | $28,000 |
| 2018 | $1,171 | $35,300 | $7,300 | $28,000 |
| 2017 | $1,157 | $35,300 | $7,300 | $28,000 |
| 2016 | $1,104 | $35,300 | $7,300 | $28,000 |
| 2015 | $1,036 | $35,300 | $7,300 | $28,000 |
| 2014 | $961 | $35,300 | $7,300 | $28,000 |
Source: Public Records
Map
Nearby Homes