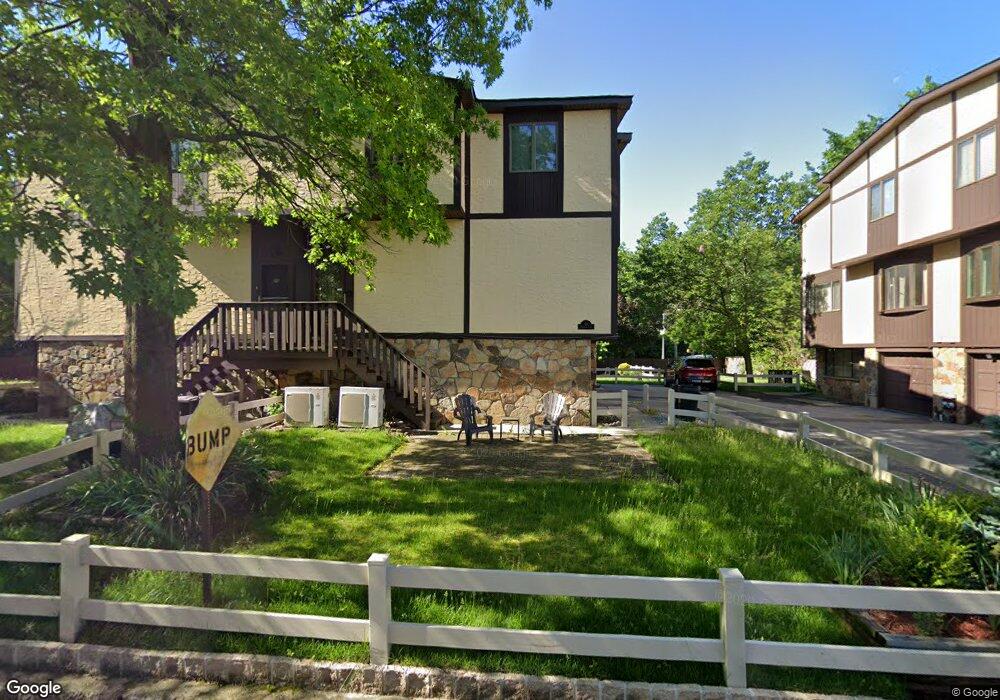
16 Parkview Loop Unit 6 Staten Island, NY 10314
Willowbrook NeighborhoodEstimated Value: $535,000 - $583,000
3
Beds
2
Baths
1,480
Sq Ft
$381/Sq Ft
Est. Value
About This Home
This home is located at 16 Parkview Loop Unit 6, Staten Island, NY 10314 and is currently estimated at $563,731, approximately $380 per square foot. 16 Parkview Loop Unit 6 is a home located in Richmond County with nearby schools including P.S. 060 Alice Austen School, Is 72 Rocco Laurie, and Port Richmond High School.
Ownership History
Date
Name
Owned For
Owner Type
Purchase Details
Closed on
Aug 8, 2013
Sold by
Delpozo Linda
Bought by
Kennedy Joann
Current Estimated Value
Home Financials for this Owner
Home Financials are based on the most recent Mortgage that was taken out on this home.
Original Mortgage
$228,000
Outstanding Balance
$169,012
Interest Rate
4.31%
Mortgage Type
New Conventional
Estimated Equity
$394,719
Purchase Details
Closed on
May 29, 2013
Sold by
Delpozo Linda and Delpozo Gus
Bought by
Delpozo Linda
Purchase Details
Closed on
May 4, 2004
Sold by
Mannanice Sebastian and Mannanice Donna
Bought by
Delpozo Gus and Delpozo Linda
Home Financials for this Owner
Home Financials are based on the most recent Mortgage that was taken out on this home.
Original Mortgage
$232,750
Interest Rate
5.71%
Mortgage Type
Purchase Money Mortgage
Purchase Details
Closed on
Aug 1, 1996
Sold by
Katz Marvin and Katz Janice
Bought by
Mannanice Sebastian and Mannanice Donna
Create a Home Valuation Report for This Property
The Home Valuation Report is an in-depth analysis detailing your home's value as well as a comparison with similar homes in the area
Home Values in the Area
Average Home Value in this Area
Purchase History
| Date | Buyer | Sale Price | Title Company |
|---|---|---|---|
| Kennedy Joann | $285,000 | None Available | |
| Delpozo Linda | -- | None Available | |
| Delpozo Gus | $245,000 | -- | |
| Mannanice Sebastian | $115,000 | -- |
Source: Public Records
Mortgage History
| Date | Status | Borrower | Loan Amount |
|---|---|---|---|
| Open | Kennedy Joann | $228,000 | |
| Previous Owner | Delpozo Gus | $232,750 |
Source: Public Records
Tax History
| Year | Tax Paid | Tax Assessment Tax Assessment Total Assessment is a certain percentage of the fair market value that is determined by local assessors to be the total taxable value of land and additions on the property. | Land | Improvement |
|---|---|---|---|---|
| 2025 | $4,867 | $34,327 | $1,753 | $32,574 |
| 2024 | $4,867 | $28,927 | $2,064 | $26,863 |
| 2023 | $4,643 | $22,862 | $1,940 | $20,922 |
| 2022 | $4,306 | $25,806 | $2,464 | $23,342 |
| 2021 | $4,283 | $23,435 | $2,464 | $20,971 |
| 2020 | $4,307 | $21,834 | $2,464 | $19,370 |
| 2019 | $4,224 | $21,834 | $2,464 | $19,370 |
| 2018 | $3,884 | $19,052 | $2,193 | $16,859 |
| 2017 | $3,664 | $17,974 | $2,249 | $15,725 |
| 2016 | $3,390 | $16,958 | $2,166 | $14,792 |
| 2015 | $3,229 | $16,958 | $2,030 | $14,928 |
| 2014 | $3,229 | $16,828 | $2,315 | $14,513 |
Source: Public Records
Map
Nearby Homes
- 14 Parkview Loop
- 15 Parkview Loop
- 60 Parkview Loop
- 44 Debbie St Unit B
- 41 Jennifer Place Unit B
- 100 Debbie St Unit B
- 59 Jennifer Place Unit a
- 71 Goller Place
- 24 Merrill Ave
- 87 Saybrook St
- 37 Dreyer Ave Unit A
- 537 Willow Rd E Unit 1
- 238 Cambridge Ave
- 251 Cambridge Ave
- 234 Cambridge Ave
- 1406 Richmond Ave
- 226 Cambridge Ave
- 38 Jones St
- 281 Arlene St
- 8 Dreyer Ave Unit A
- 18 Parkview Loop
- 20 Parkview Loop Unit 8
- 22 Parkview Loop Unit 7
- 12 Parkview Loop Unit 4
- 8 Parkview Loop Unit 2
- 10 Parkview Loop Unit 1
- 26 Parkview Loop
- 24 Parkview Loop Unit 10
- 30 Parkview Loop Unit 11
- 28 Parkview Loop Unit 12
- 17 Parkview Loop Unit 1041
- 21 Parkview Loop
- 11 Parkview Loop Unit 43
- 23 Parkview Loop
- 155 Morani St
- 153 Morani St Unit 45
- 27 Parkview Loop Unit 39
- 151 Morani St Unit 46
- 34 Parkview Loop
- 36 Parkview Loop Unit 13
Your Personal Tour Guide
Ask me questions while you tour the home.