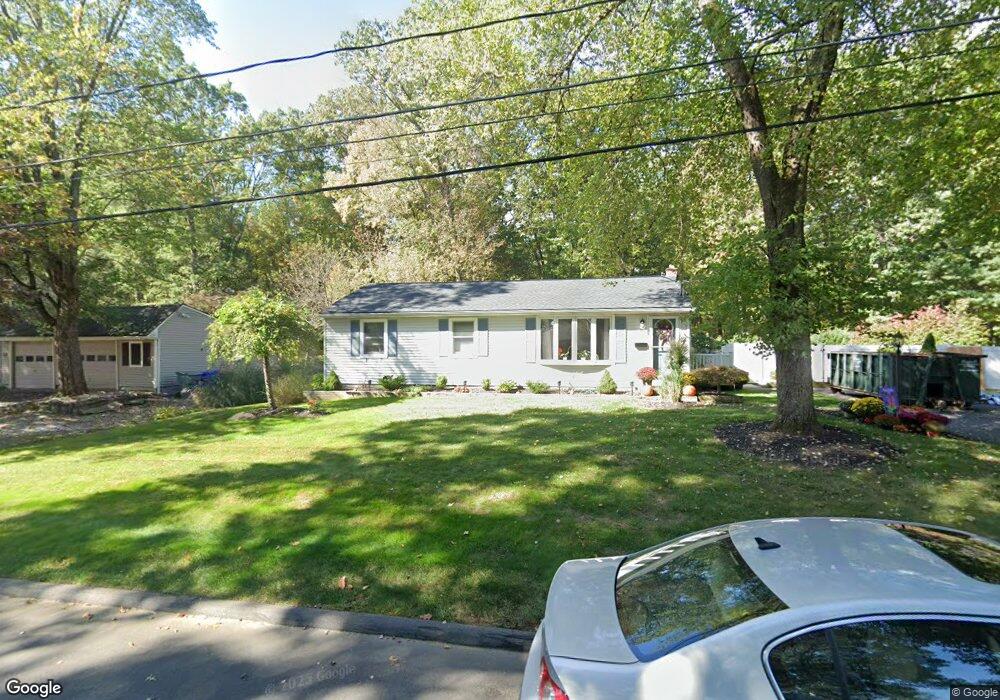
16 Rocket Run Enfield, CT 06082
Estimated Value: $293,590 - $318,000
3
Beds
1
Bath
1,008
Sq Ft
$302/Sq Ft
Est. Value
About This Home
This home is located at 16 Rocket Run, Enfield, CT 06082 and is currently estimated at $304,898, approximately $302 per square foot. 16 Rocket Run is a home located in Hartford County with nearby schools including Eli Whitney Elementary School, Hazardville Memorial Elementary School, and Enfield High School.
Ownership History
Date
Name
Owned For
Owner Type
Purchase Details
Closed on
Mar 4, 2024
Sold by
Vene Kenneth J
Bought by
Vene Kelly M and Vene Kenneth J
Current Estimated Value
Purchase Details
Closed on
Nov 18, 2005
Sold by
Cormier Thomas and Cormier Terri
Bought by
Vene Kenneth
Home Financials for this Owner
Home Financials are based on the most recent Mortgage that was taken out on this home.
Original Mortgage
$150,400
Interest Rate
7.94%
Mortgage Type
Purchase Money Mortgage
Purchase Details
Closed on
Jul 31, 2000
Sold by
Lafernere Wayne and Lafernere Amy
Bought by
Cormier Thomas and Cormier Terri
Purchase Details
Closed on
Jan 9, 1992
Sold by
Moriarty Edward and Moriarty Virginia
Bought by
Laferriere Wayne and Piepul Amy
Create a Home Valuation Report for This Property
The Home Valuation Report is an in-depth analysis detailing your home's value as well as a comparison with similar homes in the area
Home Values in the Area
Average Home Value in this Area
Purchase History
| Date | Buyer | Sale Price | Title Company |
|---|---|---|---|
| Vene Kelly M | -- | None Available | |
| Vene Kenneth | $188,000 | -- | |
| Cormier Thomas | $121,000 | -- | |
| Laferriere Wayne | $124,000 | -- | |
| Laferriere Wayne | $124,000 | -- |
Source: Public Records
Mortgage History
| Date | Status | Borrower | Loan Amount |
|---|---|---|---|
| Previous Owner | Laferriere Wayne | $150,400 | |
| Previous Owner | Laferriere Wayne | $37,600 | |
| Previous Owner | Laferriere Wayne | $120,000 |
Source: Public Records
Tax History
| Year | Tax Paid | Tax Assessment Tax Assessment Total Assessment is a certain percentage of the fair market value that is determined by local assessors to be the total taxable value of land and additions on the property. | Land | Improvement |
|---|---|---|---|---|
| 2025 | $4,629 | $132,300 | $56,600 | $75,700 |
| 2024 | $4,505 | $132,300 | $56,600 | $75,700 |
| 2023 | $4,472 | $132,300 | $56,600 | $75,700 |
| 2022 | $4,060 | $132,300 | $56,600 | $75,700 |
| 2021 | $3,877 | $103,310 | $46,890 | $56,420 |
| 2020 | $3,877 | $103,310 | $46,890 | $56,420 |
| 2019 | $3,888 | $103,310 | $46,890 | $56,420 |
| 2018 | $3,822 | $103,310 | $46,890 | $56,420 |
| 2017 | $3,609 | $103,310 | $46,890 | $56,420 |
| 2016 | $3,538 | $103,110 | $48,110 | $55,000 |
| 2015 | $3,427 | $103,110 | $48,110 | $55,000 |
| 2014 | $3,339 | $103,110 | $48,110 | $55,000 |
Source: Public Records
Map
Nearby Homes
Your Personal Tour Guide
Ask me questions while you tour the home.