Estimated Value: $200,561 - $251,000
Studio
2
Baths
1,472
Sq Ft
$148/Sq Ft
Est. Value
About This Home
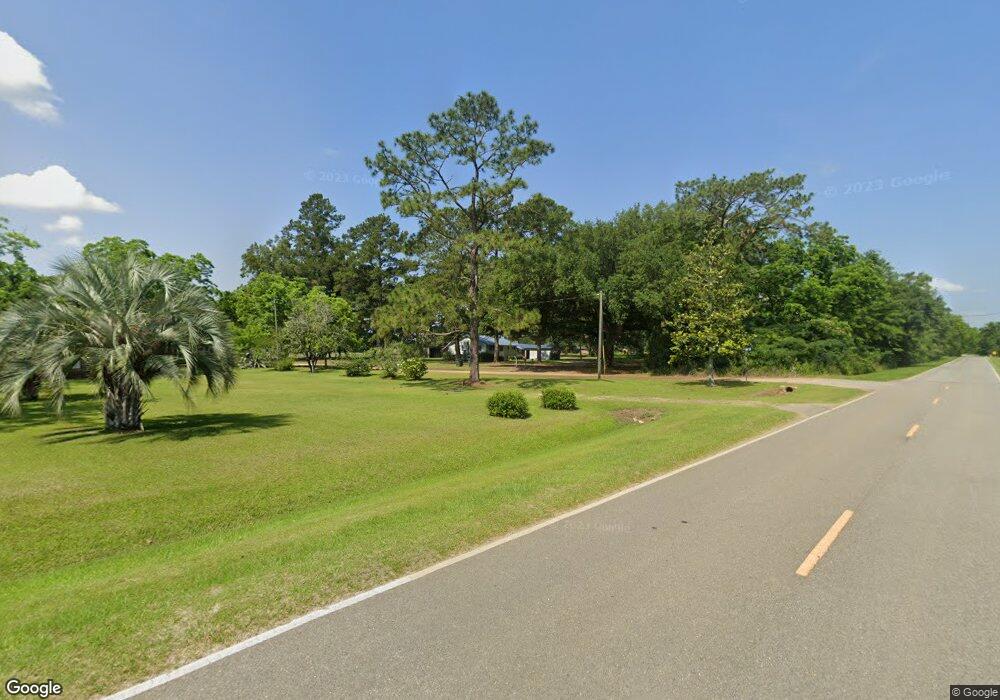
This home is located at 16 Scott Ln, Dixie, GA 31629 and is currently estimated at $218,187, approximately $148 per square foot. 16 Scott Ln is a home located in Brooks County with nearby schools including Quitman Elementary School.
Ownership History
Date
Name
Owned For
Owner Type
Purchase Details
Closed on
Jun 18, 2020
Sold by
Scott Roger
Bought by
Scott Virgil
Current Estimated Value
Create a Home Valuation Report for This Property
The Home Valuation Report is an in-depth analysis detailing your home's value as well as a comparison with similar homes in the area
Purchase History
| Date | Buyer | Sale Price | Title Company |
|---|---|---|---|
| Scott Virgil | -- | -- |
Source: Public Records
Tax History
| Year | Tax Paid | Tax Assessment Tax Assessment Total Assessment is a certain percentage of the fair market value that is determined by local assessors to be the total taxable value of land and additions on the property. | Land | Improvement |
|---|---|---|---|---|
| 2025 | $1,587 | $47,148 | $17,560 | $29,588 |
| 2024 | $1,931 | $60,628 | $17,560 | $43,068 |
| 2023 | $1,792 | $55,188 | $16,680 | $38,508 |
| 2022 | $1,674 | $46,068 | $15,880 | $30,188 |
| 2021 | $1,556 | $43,468 | $15,560 | $27,908 |
| 2020 | $1,168 | $42,068 | $15,560 | $26,508 |
| 2019 | $1,218 | $41,028 | $15,880 | $25,148 |
| 2018 | $1,175 | $40,228 | $15,080 | $25,148 |
| 2017 | $1,150 | $39,268 | $15,080 | $24,188 |
| 2016 | $1,181 | $39,268 | $15,080 | $24,188 |
| 2015 | -- | $39,388 | $15,080 | $24,308 |
| 2014 | -- | $39,788 | $15,080 | $24,708 |
| 2013 | -- | $39,788 | $15,080 | $24,708 |
Source: Public Records
Map
Nearby Homes
- 5199 U S 84
- Dixie Rd
- 431 Dry Lake Rd
- 901 W Boundary St
- 1001 W Bartow St
- 804 Westlake Dr
- 309 Eastlake Dr
- 9900 Ozell Rd
- 304 W Rountree St
- 103 Victorian Way
- 807 N Court St
- 2156 County Road 78
- 606 N Court St
- 621 N Court St
- 203 W Gordon St
- 714 Morris Ave
- 417 N Court St
- 506 Oglesby St
- Lot 14 Dawn Ln
- 0 W Swamp St
- 5690 Dry Lake Rd
- 5710 Dry Lake Rd
- 5558 Dry Lake Rd
- 6077 Dry Lake Rd
- 0 Dry Lake Rd
- 200 Scott Ln
- 5585 Dry Lake Rd
- 5916 Dry Lake Rd
- 5781 Dry Lake Rd
- 380 Scott Ln
- 5285 Dry Lake Rd
- 6117 Dry Lake Rd
- 3089 Dewberry Rd
- 6173 Dry Lake Rd
- 5146 Dry Lake Rd
- 6148 Dry Lake Rd
- 5161 Dry Lake Rd
- 6270 Dry Lake Rd
- 5020 Dry Lake Rd
- 2842 Dewberry Rd
Your Personal Tour Guide
Ask me questions while you tour the home.