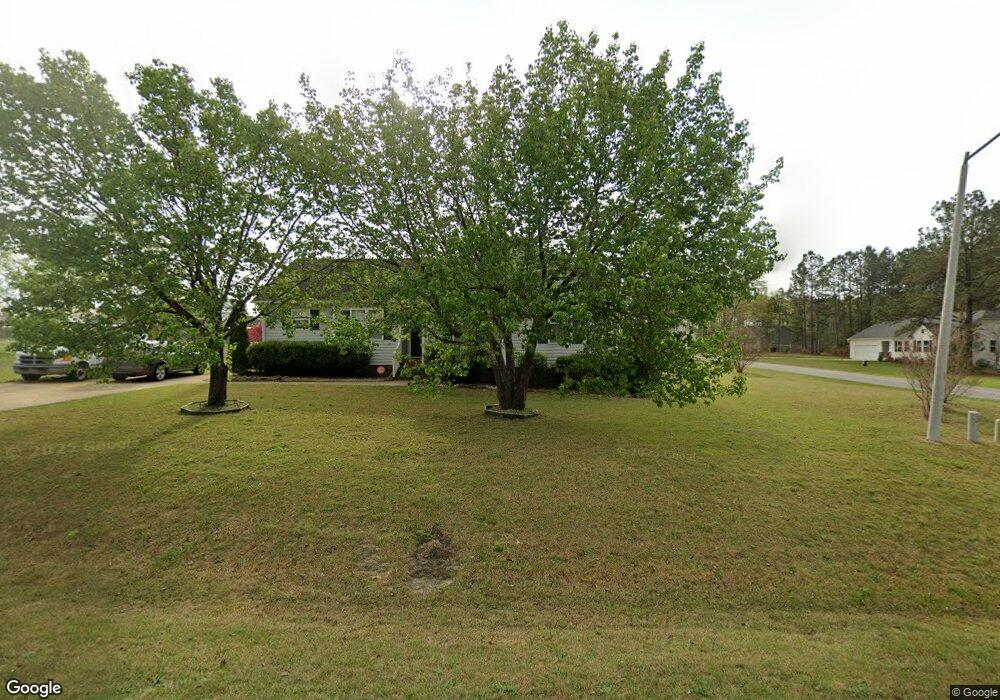
16 Sodan Dr Willow Spring, NC 27592
Pleasant Grove NeighborhoodEstimated Value: $303,113 - $335,000
3
Beds
2
Baths
1,550
Sq Ft
$204/Sq Ft
Est. Value
About This Home
This home is located at 16 Sodan Dr, Willow Spring, NC 27592 and is currently estimated at $316,528, approximately $204 per square foot. 16 Sodan Dr is a home located in Johnston County with nearby schools including Dixon Road Elementary School, McGee's Crossroads Middle School, and West Johnston High School.
Ownership History
Date
Name
Owned For
Owner Type
Purchase Details
Closed on
Nov 25, 2019
Sold by
Mupr 3 Assets Llc
Bought by
Alto Asset Company 1 Llc and Srmz 4 Asset Company 1 Llc
Current Estimated Value
Purchase Details
Closed on
Jun 4, 2019
Sold by
Avery Charlotte Ann and Allen David
Bought by
Mupr 3 Assets Llc
Purchase Details
Closed on
Mar 15, 2006
Sold by
Hall Troy D
Bought by
Avery Charlotte Ann
Home Financials for this Owner
Home Financials are based on the most recent Mortgage that was taken out on this home.
Original Mortgage
$116,400
Interest Rate
6.25%
Mortgage Type
Purchase Money Mortgage
Purchase Details
Closed on
Jan 13, 2006
Sold by
Novastar Mortgage Inc
Bought by
Hall Troy D
Purchase Details
Closed on
Oct 6, 2005
Sold by
Sowell Reginald L and Sowell Alison A
Bought by
Novastar Mortgage Inc
Purchase Details
Closed on
Nov 26, 2001
Sold by
Sowell Reginald L
Bought by
Build Rite Inc
Create a Home Valuation Report for This Property
The Home Valuation Report is an in-depth analysis detailing your home's value as well as a comparison with similar homes in the area
Home Values in the Area
Average Home Value in this Area
Purchase History
| Date | Buyer | Sale Price | Title Company |
|---|---|---|---|
| Alto Asset Company 1 Llc | $1,776,000 | Bchh Title Inc | |
| Mupr 3 Assets Llc | $193,500 | None Available | |
| Avery Charlotte Ann | $120,000 | Investors Title Insurance Co | |
| Hall Troy D | $95,000 | None Available | |
| Novastar Mortgage Inc | $101,700 | None Available | |
| Build Rite Inc | $114,000 | -- |
Source: Public Records
Mortgage History
| Date | Status | Borrower | Loan Amount |
|---|---|---|---|
| Previous Owner | Avery Charlotte Ann | $116,400 |
Source: Public Records
Tax History
| Year | Tax Paid | Tax Assessment Tax Assessment Total Assessment is a certain percentage of the fair market value that is determined by local assessors to be the total taxable value of land and additions on the property. | Land | Improvement |
|---|---|---|---|---|
| 2025 | $1,784 | $281,000 | $75,000 | $206,000 |
| 2024 | $1,295 | $159,850 | $40,000 | $119,850 |
| 2023 | $1,255 | $159,850 | $40,000 | $119,850 |
| 2022 | $1,295 | $159,850 | $40,000 | $119,850 |
| 2021 | $1,295 | $159,850 | $40,000 | $119,850 |
| 2020 | $1,343 | $159,850 | $40,000 | $119,850 |
| 2019 | $1,217 | $148,450 | $40,000 | $108,450 |
| 2018 | $1,035 | $123,210 | $25,000 | $98,210 |
| 2017 | $1,035 | $123,210 | $25,000 | $98,210 |
| 2016 | $1,035 | $123,210 | $25,000 | $98,210 |
| 2015 | $1,035 | $123,210 | $25,000 | $98,210 |
| 2014 | $1,035 | $123,210 | $25,000 | $98,210 |
Source: Public Records
Map
Nearby Homes
- 58 Tractor Place
- 118 Kayleigh Ct
- 167 Windy Dr
- 16 Saddle Ridge Dr
- 322 Saddle Ridge Dr
- 115 Edmondson Dr
- 77 Balsawood Ct
- 120 Cricket Hill Way
- 142 Jacqueline Dr
- 200 Reese Dr
- 47 Kiowa Ct
- 59 Mineral Springs Way
- 249 Bradley Dr
- 93 Hot Springs Way
- 52 Hot Springs Way
- 32 Hot Springs Way
- 86 Hot Springs Way
- 228 Tamworth Dr
- 304 Artic Cir
- 1190 Sanders Rd
- 40 Sodan Dr
- 31 Sodan Dr
- 64 Sodan Dr
- 451 Roberts Rd
- 496 Roberts Rd
- 565 Roberts Rd
- 464 Roberts Rd
- 84 Sodan Dr
- 47 Willow Ridge Cir
- 94/70 Per 8/11 2021 Rd
- 528 Roberts Rd
- 425 Roberts Rd
- 452 Roberts Rd
- 37 Marie Ct
- 19 Marie Ct
- 112 Sodan Dr
- 87 Willow Ridge Cir
- 564 Roberts Rd
- 36 Willow Ridge Cir
- 69 Willow Ridge Cir
Your Personal Tour Guide
Ask me questions while you tour the home.