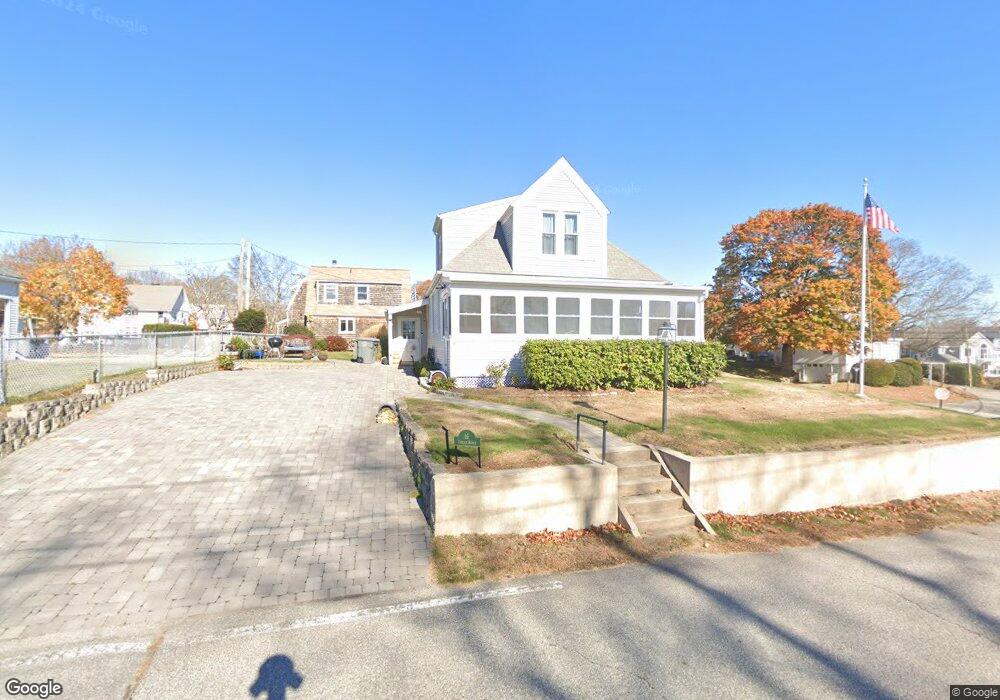
16 Terrace Ave Niantic, CT 06357
Niantic NeighborhoodEstimated Value: $533,026 - $798,000
4
Beds
2
Baths
1,774
Sq Ft
$364/Sq Ft
Est. Value
About This Home
This home is located at 16 Terrace Ave, Niantic, CT 06357 and is currently estimated at $645,507, approximately $363 per square foot. 16 Terrace Ave is a home located in New London County with nearby schools including East Lyme Middle School, East Lyme High School, and The Light House Voc-Ed Center.
Ownership History
Date
Name
Owned For
Owner Type
Purchase Details
Closed on
Nov 26, 2019
Sold by
Morris Edward
Bought by
Seibert Pamela
Current Estimated Value
Home Financials for this Owner
Home Financials are based on the most recent Mortgage that was taken out on this home.
Original Mortgage
$263,987
Outstanding Balance
$229,729
Interest Rate
3.5%
Estimated Equity
$415,778
Purchase Details
Closed on
Oct 9, 1997
Sold by
Stow Minnie B
Bought by
Morris Edward and Morris Arline R
Create a Home Valuation Report for This Property
The Home Valuation Report is an in-depth analysis detailing your home's value as well as a comparison with similar homes in the area
Home Values in the Area
Average Home Value in this Area
Purchase History
| Date | Buyer | Sale Price | Title Company |
|---|---|---|---|
| Seibert Pamela | $300,000 | -- | |
| Morris Edward | $65,900 | -- |
Source: Public Records
Mortgage History
| Date | Status | Borrower | Loan Amount |
|---|---|---|---|
| Open | Seibert Pamela | $263,987 |
Source: Public Records
Tax History
| Year | Tax Paid | Tax Assessment Tax Assessment Total Assessment is a certain percentage of the fair market value that is determined by local assessors to be the total taxable value of land and additions on the property. | Land | Improvement |
|---|---|---|---|---|
| 2025 | $6,764 | $241,500 | $103,250 | $138,250 |
| 2024 | $6,364 | $241,500 | $103,250 | $138,250 |
| 2023 | $6,009 | $241,500 | $103,250 | $138,250 |
| 2022 | $5,757 | $241,500 | $103,250 | $138,250 |
| 2021 | $5,654 | $198,310 | $98,560 | $99,750 |
| 2020 | $5,624 | $198,310 | $98,560 | $99,750 |
| 2019 | $5,590 | $198,310 | $98,560 | $99,750 |
| 2018 | $5,424 | $198,310 | $98,560 | $99,750 |
| 2017 | $5,188 | $198,310 | $98,560 | $99,750 |
| 2016 | $5,624 | $221,760 | $122,010 | $99,750 |
| 2015 | $5,480 | $221,760 | $122,010 | $99,750 |
| 2014 | $5,329 | $221,760 | $122,010 | $99,750 |
Source: Public Records
Map
Nearby Homes
- 23 Central Ave
- 127 Black Point Rd Unit 7
- 36 Attawan Rd
- 26 Mohawk Dr
- 6 Slocum Dr
- 15 Sunnieside Dr
- 13 Park Ct
- 468 Main St Unit 318
- 468 Main St Unit 111
- 9 Columbus Ave
- 42 Nehantic Dr
- 47 Village Crossing Unit 47
- 19 Sapia Dr
- 61 Whitecap Rd
- 43 Park Place
- 46 Village Crossing Unit 46
- 12 Spinnaker Dr
- 86 Corey Ln
- 54 Sea Crest Ave
- 97 W Main St Unit 36
Your Personal Tour Guide
Ask me questions while you tour the home.