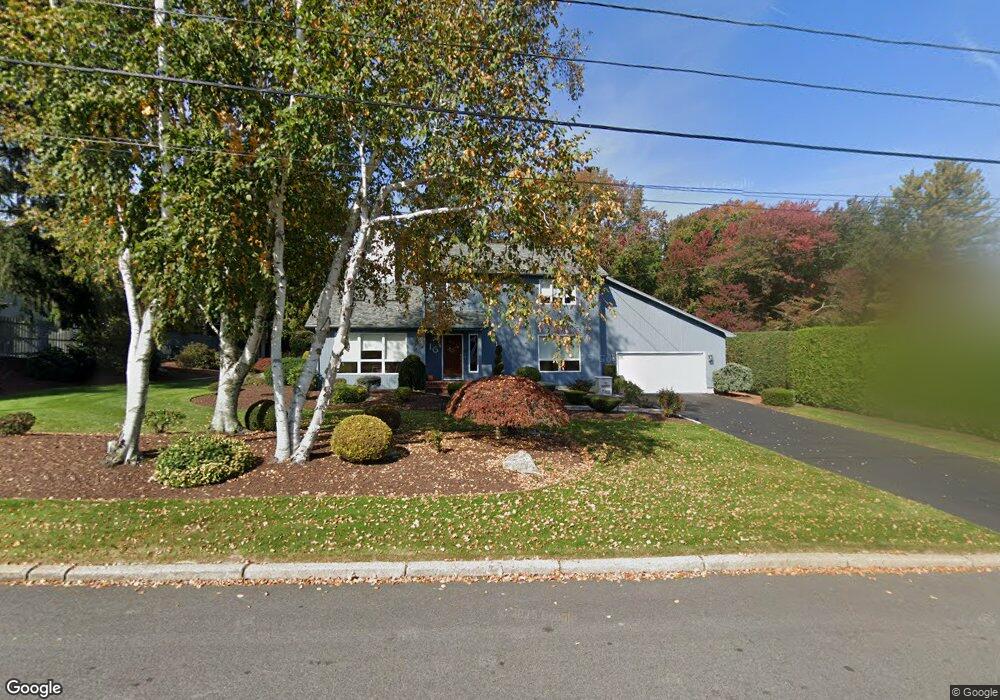
16 Thomas Ln Cranston, RI 02921
Comstock Gardens NeighborhoodEstimated Value: $720,601 - $968,000
2
Beds
3
Baths
2,400
Sq Ft
$329/Sq Ft
Est. Value
About This Home
This home is located at 16 Thomas Ln, Cranston, RI 02921 and is currently estimated at $789,900, approximately $329 per square foot. 16 Thomas Ln is a home located in Providence County with nearby schools including Orchard Farms El. School, Western Hills Middle School, and Cranston High School West.
Ownership History
Date
Name
Owned For
Owner Type
Purchase Details
Closed on
Oct 11, 1996
Sold by
Lafazia Kenneth A and Lafazia Maryann
Bought by
Gentili Michael H and Gentili Joan
Current Estimated Value
Home Financials for this Owner
Home Financials are based on the most recent Mortgage that was taken out on this home.
Original Mortgage
$22,500
Interest Rate
8.06%
Create a Home Valuation Report for This Property
The Home Valuation Report is an in-depth analysis detailing your home's value as well as a comparison with similar homes in the area
Home Values in the Area
Average Home Value in this Area
Purchase History
| Date | Buyer | Sale Price | Title Company |
|---|---|---|---|
| Gentili Michael H | $210,000 | -- |
Source: Public Records
Mortgage History
| Date | Status | Borrower | Loan Amount |
|---|---|---|---|
| Open | Gentili Michael H | $190,000 | |
| Closed | Gentili Michael H | $50,000 | |
| Closed | Gentili Michael H | $22,500 |
Source: Public Records
Tax History Compared to Growth
Tax History
| Year | Tax Paid | Tax Assessment Tax Assessment Total Assessment is a certain percentage of the fair market value that is determined by local assessors to be the total taxable value of land and additions on the property. | Land | Improvement |
|---|---|---|---|---|
| 2025 | $8,081 | $582,200 | $161,200 | $421,000 |
| 2024 | $7,924 | $582,200 | $161,200 | $421,000 |
| 2023 | $7,887 | $417,300 | $119,600 | $297,700 |
| 2022 | $7,724 | $417,300 | $119,600 | $297,700 |
| 2021 | $7,511 | $417,300 | $119,600 | $297,700 |
| 2020 | $8,406 | $404,700 | $128,200 | $276,500 |
| 2019 | $8,406 | $404,700 | $128,200 | $276,500 |
| 2018 | $8,211 | $404,700 | $128,200 | $276,500 |
| 2017 | $8,421 | $367,100 | $115,400 | $251,700 |
| 2016 | $8,241 | $367,100 | $115,400 | $251,700 |
| 2015 | $8,241 | $367,100 | $115,400 | $251,700 |
| 2014 | $8,958 | $392,200 | $128,200 | $264,000 |
Source: Public Records
Map
Nearby Homes
- 9 Gray Coach E
- 53 Charcalee Dr
- 18 Quail Ridge Rd
- 121 Ashbrook Dr
- 80 Tomahawk Trail
- 20 Doreen Ct
- 2 Mulberry Dr
- 102 Moccasin Trail
- 26 Scituate Farms Dr
- 95 Amy Dr
- 105 Amy Dr
- 0 Anthony Dr Unit 1394338
- 10 Honey Lou Ct
- 7 Taylor Rd
- 02 Paula Ln
- 01 Paula Ln
- 2073 Plainfield Pike
- 17 Woodview Dr
- 11 Raven Cir
- 435 Scituate Ave