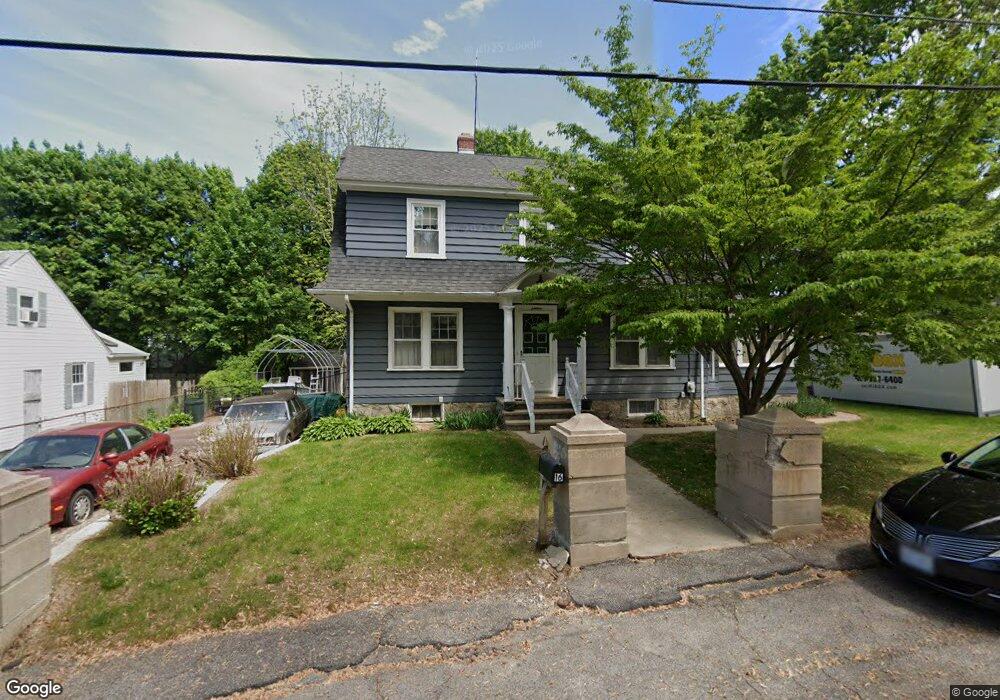
16 Tobin St West Warwick, RI 02893
West Warwick Centre NeighborhoodEstimated Value: $381,069 - $397,000
3
Beds
2
Baths
1,664
Sq Ft
$233/Sq Ft
Est. Value
About This Home
This home is located at 16 Tobin St, West Warwick, RI 02893 and is currently estimated at $388,517, approximately $233 per square foot. 16 Tobin St is a home located in Kent County with nearby schools including West Warwick High School and Islamic School of Rhode Island.
Ownership History
Date
Name
Owned For
Owner Type
Purchase Details
Closed on
May 18, 2022
Sold by
West Warwick Town Of
Bought by
Conley Patrick
Current Estimated Value
Purchase Details
Closed on
Dec 20, 2013
Sold by
Senerchia Thomas F and Senerchia Gail
Bought by
West Warwick Town Of
Purchase Details
Closed on
Jun 21, 2011
Sold by
Senerchia Thomas F and West Warwick Town Of
Bought by
9-3 Realty Rigp
Create a Home Valuation Report for This Property
The Home Valuation Report is an in-depth analysis detailing your home's value as well as a comparison with similar homes in the area
Home Values in the Area
Average Home Value in this Area
Purchase History
| Date | Buyer | Sale Price | Title Company |
|---|---|---|---|
| Conley Patrick | $921 | None Available | |
| Harbor Heights Llc | $22,702 | None Available | |
| West Warwick Town Of | -- | -- | |
| 9-3 Realty Rigp | $663 | -- |
Source: Public Records
Tax History Compared to Growth
Tax History
| Year | Tax Paid | Tax Assessment Tax Assessment Total Assessment is a certain percentage of the fair market value that is determined by local assessors to be the total taxable value of land and additions on the property. | Land | Improvement |
|---|---|---|---|---|
| 2025 | $4,354 | $304,700 | $57,400 | $247,300 |
| 2024 | $4,211 | $225,300 | $45,200 | $180,100 |
| 2023 | $4,127 | $225,300 | $45,200 | $180,100 |
| 2022 | $4,064 | $225,300 | $45,200 | $180,100 |
| 2021 | $4,158 | $180,800 | $45,200 | $135,600 |
| 2020 | $4,158 | $180,800 | $45,200 | $135,600 |
| 2019 | $5,301 | $180,800 | $45,200 | $135,600 |
| 2018 | $63 | $155,800 | $45,200 | $110,600 |
| 2017 | $4,099 | $155,800 | $45,200 | $110,600 |
| 2016 | $4,026 | $155,800 | $45,200 | $110,600 |
| 2015 | $3,692 | $142,200 | $45,200 | $97,000 |
| 2014 | $3,610 | $142,200 | $45,200 | $97,000 |
Source: Public Records
Map
Nearby Homes