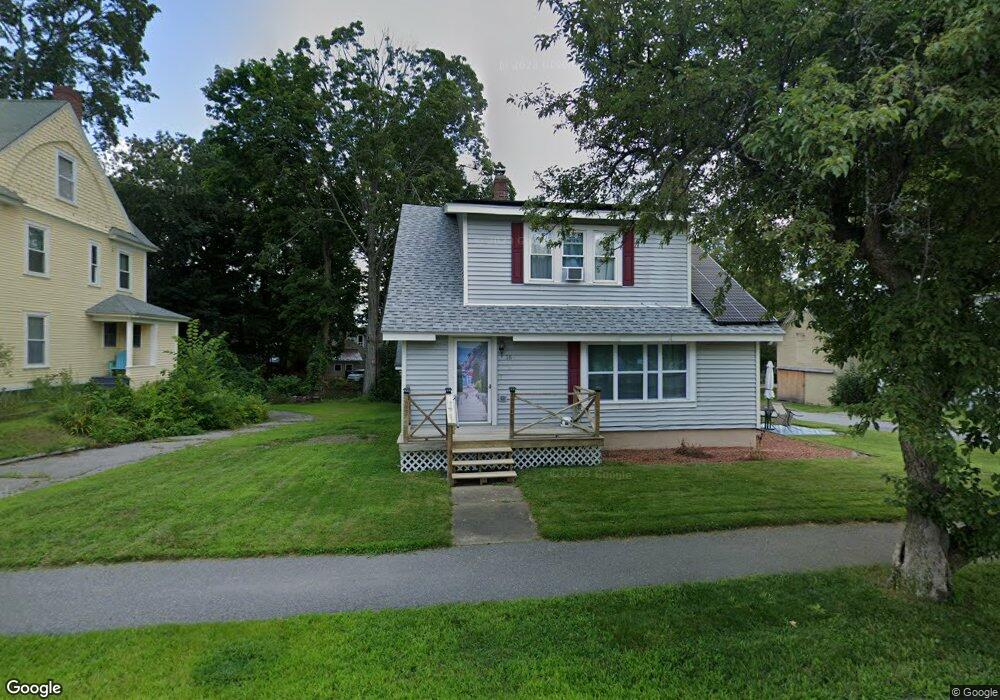
16 White St Concord, NH 03301
North End NeighborhoodEstimated Value: $433,298 - $481,000
3
Beds
2
Baths
1,450
Sq Ft
$311/Sq Ft
Est. Value
About This Home
This home is located at 16 White St, Concord, NH 03301 and is currently estimated at $451,325, approximately $311 per square foot. 16 White St is a home located in Merrimack County with nearby schools including Christa McAuliffe School, Rundlett Middle School, and Concord High School.
Ownership History
Date
Name
Owned For
Owner Type
Purchase Details
Closed on
Feb 8, 2023
Sold by
Frary Michael J and Frary Christina M
Bought by
Michael Frary Ft and Frary
Current Estimated Value
Purchase Details
Closed on
Nov 5, 2018
Sold by
Robert H Rines Ret and Hayes-Rines
Bought by
Frary Christina M and Frary Michael J
Home Financials for this Owner
Home Financials are based on the most recent Mortgage that was taken out on this home.
Original Mortgage
$238,450
Interest Rate
4.25%
Mortgage Type
New Conventional
Purchase Details
Closed on
Jun 17, 1993
Bought by
Robert H Rines T
Create a Home Valuation Report for This Property
The Home Valuation Report is an in-depth analysis detailing your home's value as well as a comparison with similar homes in the area
Home Values in the Area
Average Home Value in this Area
Purchase History
| Date | Buyer | Sale Price | Title Company |
|---|---|---|---|
| Michael Frary Ft | -- | None Available | |
| Frary Christina M | $251,000 | -- | |
| Robert H Rines T | -- | -- |
Source: Public Records
Mortgage History
| Date | Status | Borrower | Loan Amount |
|---|---|---|---|
| Previous Owner | Frary Christina M | $238,450 |
Source: Public Records
Tax History
| Year | Tax Paid | Tax Assessment Tax Assessment Total Assessment is a certain percentage of the fair market value that is determined by local assessors to be the total taxable value of land and additions on the property. | Land | Improvement |
|---|---|---|---|---|
| 2025 | $8,037 | $276,100 | $132,600 | $143,500 |
| 2024 | $7,645 | $276,100 | $132,600 | $143,500 |
| 2023 | $7,416 | $276,100 | $132,600 | $143,500 |
| 2022 | $7,148 | $276,100 | $132,600 | $143,500 |
| 2021 | $6,893 | $274,400 | $132,600 | $141,800 |
| 2020 | $6,578 | $245,800 | $106,300 | $139,500 |
| 2019 | $6,289 | $226,400 | $102,800 | $123,600 |
| 2018 | $6,052 | $214,700 | $98,600 | $116,100 |
| 2017 | $5,736 | $203,100 | $96,000 | $107,100 |
| 2016 | $5,587 | $201,900 | $96,000 | $105,900 |
| 2015 | $5,208 | $190,500 | $96,000 | $94,500 |
| 2014 | $5,107 | $190,500 | $96,000 | $94,500 |
| 2013 | $4,781 | $186,900 | $96,000 | $90,900 |
| 2012 | $4,928 | $202,200 | $96,000 | $106,200 |
Source: Public Records
Map
Nearby Homes
- 9 Forest St
- 135 Liberty St
- 15 Wyman St Unit 9
- 25 N Spring St
- 13-15 Walker St
- 30 Penacook St
- 7-9 Myrtle St
- 47 South St
- 58 S State St
- 196 N State St
- 19 Grappone Dr
- 111 -113 South Main St
- 28 Stevens Dr
- 47 Noyes St
- 441, 443 N State St
- 273-279 S Main St
- 0 South St Unit 4969509
- 335 S Main St
- 5 Ormond St
- 22 Fairfield Dr
Your Personal Tour Guide
Ask me questions while you tour the home.