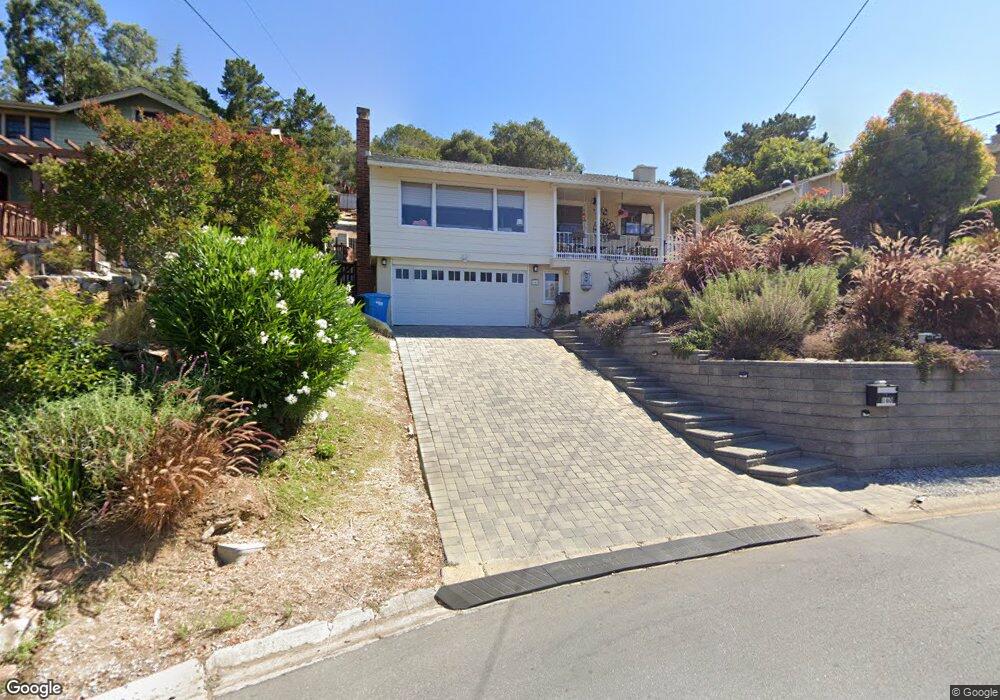
160 Arundel Rd San Carlos, CA 94070
Cordes NeighborhoodEstimated Value: $2,134,420 - $2,415,000
3
Beds
1
Bath
1,220
Sq Ft
$1,843/Sq Ft
Est. Value
About This Home
This home is located at 160 Arundel Rd, San Carlos, CA 94070 and is currently estimated at $2,248,105, approximately $1,842 per square foot. 160 Arundel Rd is a home located in San Mateo County with nearby schools including Arundel Elementary School, Tierra Linda Middle School, and Carlmont High School.
Ownership History
Date
Name
Owned For
Owner Type
Purchase Details
Closed on
Aug 14, 2013
Sold by
Waychunas Glenn A and Kuhli Linda A
Bought by
Waychunas Glenn A and Kuhli Linda Ann
Current Estimated Value
Purchase Details
Closed on
May 6, 2011
Sold by
Snyder Lynn
Bought by
Snyder Lynn W
Purchase Details
Closed on
Mar 22, 2002
Sold by
Snyder Kenneth James
Bought by
Snyder Lynn
Home Financials for this Owner
Home Financials are based on the most recent Mortgage that was taken out on this home.
Original Mortgage
$420,000
Interest Rate
5.87%
Purchase Details
Closed on
Jul 21, 1998
Sold by
Lloyd Michael
Bought by
Lloyd Michael A
Purchase Details
Closed on
Jul 21, 1997
Sold by
David Shayer
Bought by
Lloyd Michael
Home Financials for this Owner
Home Financials are based on the most recent Mortgage that was taken out on this home.
Original Mortgage
$325,000
Interest Rate
7.25%
Create a Home Valuation Report for This Property
The Home Valuation Report is an in-depth analysis detailing your home's value as well as a comparison with similar homes in the area
Home Values in the Area
Average Home Value in this Area
Purchase History
| Date | Buyer | Sale Price | Title Company |
|---|---|---|---|
| Waychunas Glenn A | -- | None Available | |
| Snyder Lynn W | -- | None Available | |
| Snyder Lynn | -- | First American Title Co | |
| Snyder Lynn | $630,000 | First American Title Co | |
| Lloyd Michael A | -- | -- | |
| Lloyd Michael | $406,500 | First American Title Co |
Source: Public Records
Mortgage History
| Date | Status | Borrower | Loan Amount |
|---|---|---|---|
| Previous Owner | Snyder Lynn | $420,000 | |
| Previous Owner | Lloyd Michael | $325,000 | |
| Closed | Lloyd Michael | $40,625 |
Source: Public Records
Tax History Compared to Growth
Tax History
| Year | Tax Paid | Tax Assessment Tax Assessment Total Assessment is a certain percentage of the fair market value that is determined by local assessors to be the total taxable value of land and additions on the property. | Land | Improvement |
|---|---|---|---|---|
| 2025 | $13,790 | $1,083,680 | $465,340 | $618,340 |
| 2023 | $13,790 | $1,047,542 | $447,271 | $600,271 |
| 2022 | $13,046 | $1,030,002 | $438,501 | $591,501 |
| 2021 | $12,892 | $1,012,806 | $429,903 | $582,903 |
| 2020 | $12,453 | $975,990 | $425,495 | $550,495 |
| 2019 | $12,014 | $938,304 | $417,152 | $521,152 |
| 2018 | $11,719 | $921,946 | $408,973 | $512,973 |
| 2017 | $11,585 | $905,908 | $400,954 | $504,954 |
| 2016 | $11,033 | $861,186 | $393,093 | $468,093 |
| 2015 | $10,744 | $826,378 | $387,189 | $439,189 |
| 2014 | $10,289 | $799,210 | $379,605 | $419,605 |
Source: Public Records
Map
Nearby Homes
- 5 Spring Valley Way
- 21 Highland Ave
- 300 Manzanita Ave
- 158 Manor Dr
- 88 Madera Ave
- 212 Manor Dr
- 70 Ensenada Rd
- 65 Madera Ave
- 53 Madera Ave
- 39 Madera Ave
- 1667 San Carlos Ave Unit 301
- 171 Exeter Ave
- 28 Kirkwood Way
- 162 Coronado Ave
- 241 Shelford Ave
- 656 Cedar St Unit 3
- 0 Devonshire Blvd
- 46 Arch Ln
- 7 Chestnut St
- 1555 Cherry St Unit 12
- 164 Arundel Rd
- 152 Arundel Rd
- 2 Spring Valley Way
- 10 Spring Valley Way
- 146 Arundel Rd
- 20 Spring Valley Way
- 144 Arundel Rd
- 153 Arundel Rd
- 145 Highland Ave
- 140 Arundel Rd
- 125 Highland Ave
- 133 Highland Ave
- 355 Phelps Rd
- 147 Arundel Rd
- 201 Arundel Rd
- 117 Highland Ave
- 147 Highland Ave
- 420 Phelps Rd
- 136 Arundel Rd
- 325 Phelps Rd