Estimated Value: $290,000 - $359,261
6
Beds
2
Baths
2,029
Sq Ft
$156/Sq Ft
Est. Value
About This Home
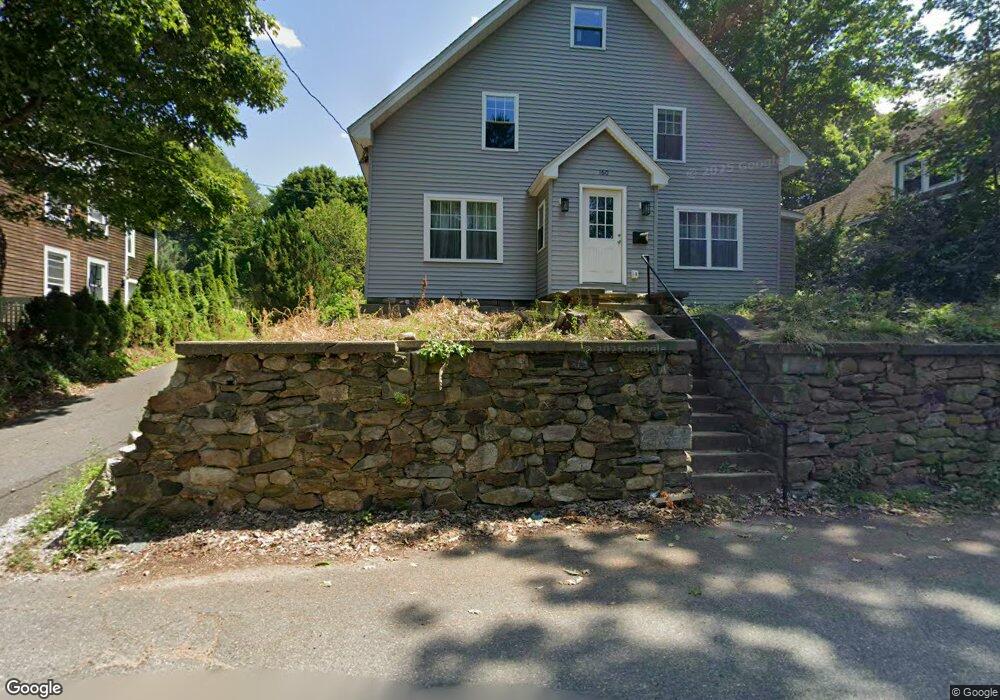
This home is located at 160 Cottage St, Athol, MA 01331 and is currently estimated at $316,815, approximately $156 per square foot. 160 Cottage St is a home located in Worcester County with nearby schools including Athol High School.
Ownership History
Date
Name
Owned For
Owner Type
Purchase Details
Closed on
Feb 2, 2022
Sold by
Surlej Ewa
Bought by
Surlej Marlena
Current Estimated Value
Purchase Details
Closed on
Aug 7, 2017
Sold by
Alexander Heidi
Bought by
Surlej Arkadiusz and Surlej Ewa
Purchase Details
Closed on
Feb 18, 2011
Sold by
Aurora Loan Svcs Llc
Bought by
Alexander Heidi
Purchase Details
Closed on
Oct 6, 2009
Sold by
Phelps Scott G and Citimortgage Inc
Bought by
Aurora Loan Services L
Purchase Details
Closed on
Sep 12, 2002
Sold by
Dana Road Rt and Jolly
Bought by
Phelps Scott G
Home Financials for this Owner
Home Financials are based on the most recent Mortgage that was taken out on this home.
Original Mortgage
$96,000
Interest Rate
6.48%
Mortgage Type
Purchase Money Mortgage
Purchase Details
Closed on
Aug 23, 2001
Sold by
Athol Town Of
Bought by
Jolly Lori
Home Financials for this Owner
Home Financials are based on the most recent Mortgage that was taken out on this home.
Original Mortgage
$40,000
Interest Rate
7.21%
Mortgage Type
Purchase Money Mortgage
Create a Home Valuation Report for This Property
The Home Valuation Report is an in-depth analysis detailing your home's value as well as a comparison with similar homes in the area
Home Values in the Area
Average Home Value in this Area
Purchase History
| Date | Buyer | Sale Price | Title Company |
|---|---|---|---|
| Surlej Marlena | -- | None Available | |
| Surlej Arkadiusz | $15,000 | -- | |
| Alexander Heidi | $20,900 | -- | |
| Aurora Loan Services L | $40,000 | -- | |
| Phelps Scott G | $120,000 | -- | |
| Jolly Lori | $17,000 | -- |
Source: Public Records
Mortgage History
| Date | Status | Borrower | Loan Amount |
|---|---|---|---|
| Previous Owner | Jolly Lori | $96,000 | |
| Previous Owner | Jolly Lori | $40,000 |
Source: Public Records
Tax History Compared to Growth
Tax History
| Year | Tax Paid | Tax Assessment Tax Assessment Total Assessment is a certain percentage of the fair market value that is determined by local assessors to be the total taxable value of land and additions on the property. | Land | Improvement |
|---|---|---|---|---|
| 2025 | $3,424 | $269,400 | $49,900 | $219,500 |
| 2024 | $3,264 | $254,400 | $49,900 | $204,500 |
| 2023 | $775 | $55,200 | $36,200 | $19,000 |
| 2022 | $783 | $48,800 | $34,400 | $14,400 |
| 2021 | $777 | $44,000 | $31,300 | $12,700 |
| 2020 | $699 | $40,700 | $28,500 | $12,200 |
| 2019 | $665 | $38,100 | $26,900 | $11,200 |
| 2018 | $673 | $34,400 | $24,400 | $10,000 |
| 2017 | $989 | $48,500 | $24,400 | $24,100 |
| 2016 | $954 | $48,100 | $24,400 | $23,700 |
| 2015 | $915 | $48,100 | $24,400 | $23,700 |
| 2014 | $886 | $48,100 | $24,400 | $23,700 |
Source: Public Records
Map
Nearby Homes
- 161 Prospect St
- 9 Kendall St
- 22 Charles Place
- 91 Cottage St Unit A
- 98 Drury Ave
- 631 Chestnut St
- 282 School St
- 350 Riverbend St Unit 109
- 128 Allen St
- 979 Chestnut St
- 193 Freedom St
- 182 Harrison St
- 73 Fern St
- 503 School St
- 105 Freedom St
- 124 Fish St
- 106 Ridge Ave
- 1179 Main St
- 53 Union St
- 792 Cottage St
- 148 Cottage St
- 172 Cottage St
- 138 Cottage St
- 149 Prospect St
- 182 Cottage St
- 131 Prospect St
- 173 Prospect St
- 124 Cottage St
- 141 Cottage St
- 194 Cottage St
- 119 Prospect St
- 187 Cottage St
- 157 Cottage St
- 105 Prospect St
- 110 Cottage St
- 172 Prospect St
- 74 Brown St
- 31 Charles Place
- 238 Cottage St
- 150 Prospect St