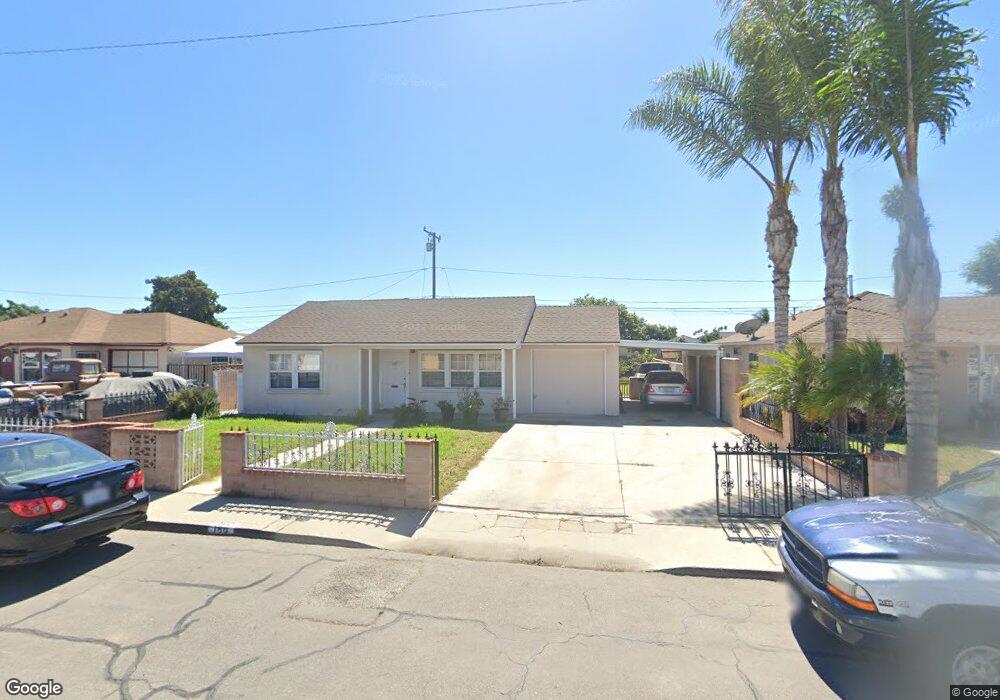
160 E Robert Ave Oxnard, CA 93033
Blackstock North NeighborhoodEstimated Value: $597,000 - $657,000
2
Beds
1
Bath
752
Sq Ft
$822/Sq Ft
Est. Value
About This Home
This home is located at 160 E Robert Ave, Oxnard, CA 93033 and is currently estimated at $618,051, approximately $821 per square foot. 160 E Robert Ave is a home located in Ventura County with nearby schools including Ansgar Larsen Elementary School, Channel Islands High School, and Santa Clara High School.
Ownership History
Date
Name
Owned For
Owner Type
Purchase Details
Closed on
Oct 10, 2003
Sold by
Vasquez Clemente and Vasquez Maria
Bought by
Vazquez Clemente and Vazquez Maria
Current Estimated Value
Home Financials for this Owner
Home Financials are based on the most recent Mortgage that was taken out on this home.
Original Mortgage
$126,000
Outstanding Balance
$59,564
Interest Rate
6.4%
Mortgage Type
Purchase Money Mortgage
Estimated Equity
$558,487
Purchase Details
Closed on
Mar 2, 1999
Sold by
Munoz Javier G and Jasso Maria Isabel
Bought by
Vazquez Clemente and Vazquez Maria
Home Financials for this Owner
Home Financials are based on the most recent Mortgage that was taken out on this home.
Original Mortgage
$129,136
Interest Rate
6.79%
Mortgage Type
FHA
Purchase Details
Closed on
Aug 29, 1995
Sold by
Munoz Gerardo Gonzalez
Bought by
Munoz Javier Gonzalez and Perez Maria Isabel Jasso
Create a Home Valuation Report for This Property
The Home Valuation Report is an in-depth analysis detailing your home's value as well as a comparison with similar homes in the area
Home Values in the Area
Average Home Value in this Area
Purchase History
| Date | Buyer | Sale Price | Title Company |
|---|---|---|---|
| Vazquez Clemente | $42,000 | Lawyers Title Company | |
| Vazquez Clemente | $130,000 | First American Title Ins Co | |
| Munoz Javier Gonzalez | -- | -- |
Source: Public Records
Mortgage History
| Date | Status | Borrower | Loan Amount |
|---|---|---|---|
| Open | Vazquez Clemente | $126,000 | |
| Closed | Vazquez Clemente | $129,136 |
Source: Public Records
Tax History
| Year | Tax Paid | Tax Assessment Tax Assessment Total Assessment is a certain percentage of the fair market value that is determined by local assessors to be the total taxable value of land and additions on the property. | Land | Improvement |
|---|---|---|---|---|
| 2025 | $3,195 | $275,642 | $124,233 | $151,409 |
| 2024 | $3,195 | $270,238 | $121,797 | $148,441 |
| 2023 | $3,014 | $264,940 | $119,409 | $145,531 |
| 2022 | $2,951 | $259,746 | $117,068 | $142,678 |
| 2021 | $2,986 | $254,653 | $114,772 | $139,881 |
| 2020 | $3,040 | $252,045 | $113,597 | $138,448 |
| 2019 | $2,947 | $247,104 | $111,370 | $135,734 |
| 2018 | $2,837 | $242,260 | $109,187 | $133,073 |
| 2017 | $2,743 | $237,511 | $107,047 | $130,464 |
| 2016 | $2,611 | $232,855 | $104,949 | $127,906 |
| 2015 | $2,650 | $229,360 | $103,374 | $125,986 |
| 2014 | $2,437 | $211,000 | $95,000 | $116,000 |
Source: Public Records
Map
Nearby Homes
- 3151 Fournier St
- 3130 Paula St
- 3631 La Costa Place
- 3638 S B St
- 360 Ibsen Place Unit 129
- 140 Gaviota Place Unit 157
- 860 Morro Way
- 225 W Iris St
- 4160 Petit Dr Unit 39
- 320 Columbia Place Unit 46
- 280 Columbia Place Unit 48
- 4029 S B St
- 4200 S A St
- 3820 S J St
- 775 Thayer Ln
- 2024 S J St
- 1140 Teakwood St
- 4340 Highland Ave
- 1928 San Benito St
- 1239 S C St
- 168 E Robert Ave
- 152 E Robert Ave
- 159 Frank Ave
- 176 E Robert Ave
- 144 E Robert Ave
- 167 Frank Ave
- 159 E Robert Ave
- 143 Frank Ave
- 175 Frank Ave
- 169 E Robert Ave
- 151 E Robert Ave
- 184 E Robert Ave
- 136 E Robert Ave
- 175 E Robert Ave
- 143 E Robert Ave
- 183 Frank Ave
- 135 Frank Ave
- 183 E Robert Ave
- 192 E Robert Ave
- 128 E Robert Ave
Your Personal Tour Guide
Ask me questions while you tour the home.