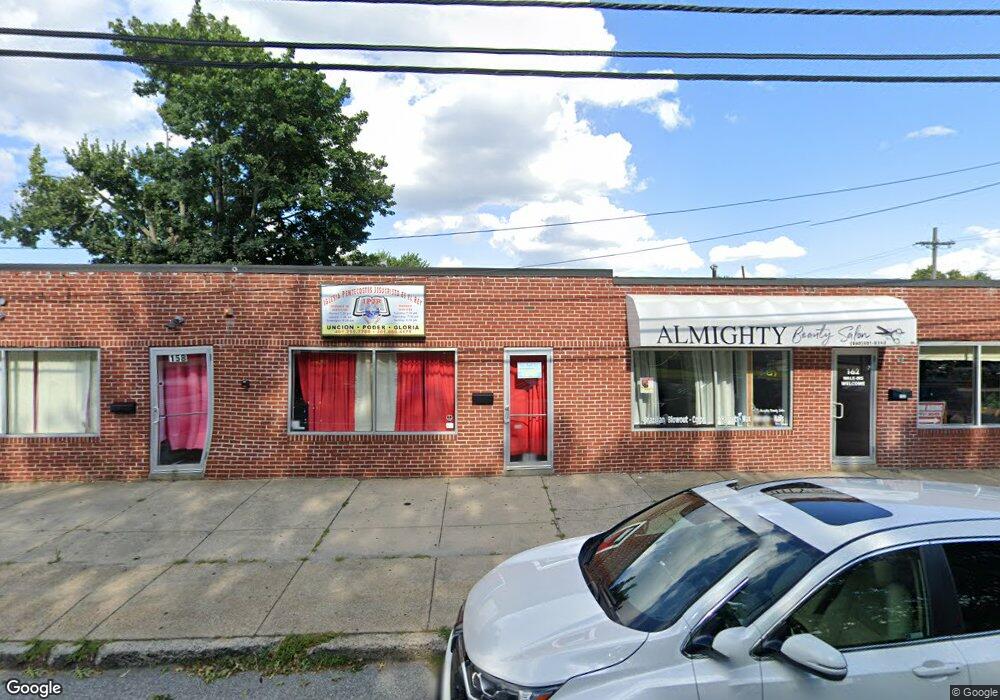
160 Gansett Ave Cranston, RI 02910
Stadium NeighborhoodEstimated Value: $847,066
Studio
--
Bath
6,108
Sq Ft
$139/Sq Ft
Est. Value
About This Home
This home is located at 160 Gansett Ave, Cranston, RI 02910 and is currently estimated at $847,066, approximately $138 per square foot. 160 Gansett Ave is a home located in Providence County with nearby schools including Stadium Elementary School, Hugh B. Bain Middle School, and Cranston High School East.
Ownership History
Date
Name
Owned For
Owner Type
Purchase Details
Closed on
Aug 27, 2019
Sold by
160 Gansett Llc
Bought by
Destiny Properties Inc
Current Estimated Value
Purchase Details
Closed on
Feb 7, 2003
Sold by
Koh Il Sok
Bought by
Destiny Properties Inc
Home Financials for this Owner
Home Financials are based on the most recent Mortgage that was taken out on this home.
Original Mortgage
$225,000
Interest Rate
5.99%
Mortgage Type
Commercial
Create a Home Valuation Report for This Property
The Home Valuation Report is an in-depth analysis detailing your home's value as well as a comparison with similar homes in the area
Home Values in the Area
Average Home Value in this Area
Purchase History
| Date | Buyer | Sale Price | Title Company |
|---|---|---|---|
| Destiny Properties Inc | $472,500 | -- | |
| 160 Gansett Llc | $525,000 | -- | |
| Destiny Properties Inc | $345,000 | -- |
Source: Public Records
Mortgage History
| Date | Status | Borrower | Loan Amount |
|---|---|---|---|
| Previous Owner | Destiny Properties Inc | $225,000 |
Source: Public Records
Tax History
| Year | Tax Paid | Tax Assessment Tax Assessment Total Assessment is a certain percentage of the fair market value that is determined by local assessors to be the total taxable value of land and additions on the property. | Land | Improvement |
|---|---|---|---|---|
| 2025 | $12,315 | $591,500 | $99,800 | $491,700 |
| 2024 | $12,078 | $591,500 | $99,800 | $491,700 |
| 2023 | $14,592 | $514,700 | $85,300 | $429,400 |
| 2022 | $14,293 | $514,700 | $85,300 | $429,400 |
| 2021 | $13,897 | $514,700 | $85,300 | $429,400 |
| 2020 | $11,174 | $358,600 | $71,600 | $287,000 |
| 2019 | $11,174 | $358,600 | $71,600 | $287,000 |
| 2018 | $10,916 | $358,600 | $71,600 | $287,000 |
| 2017 | $11,379 | $330,700 | $64,800 | $265,900 |
| 2016 | $11,138 | $330,700 | $64,800 | $265,900 |
| 2015 | $11,138 | $330,700 | $64,800 | $265,900 |
| 2014 | $11,823 | $345,200 | $76,800 | $268,400 |
Source: Public Records
Map
Nearby Homes
Your Personal Tour Guide
Ask me questions while you tour the home.