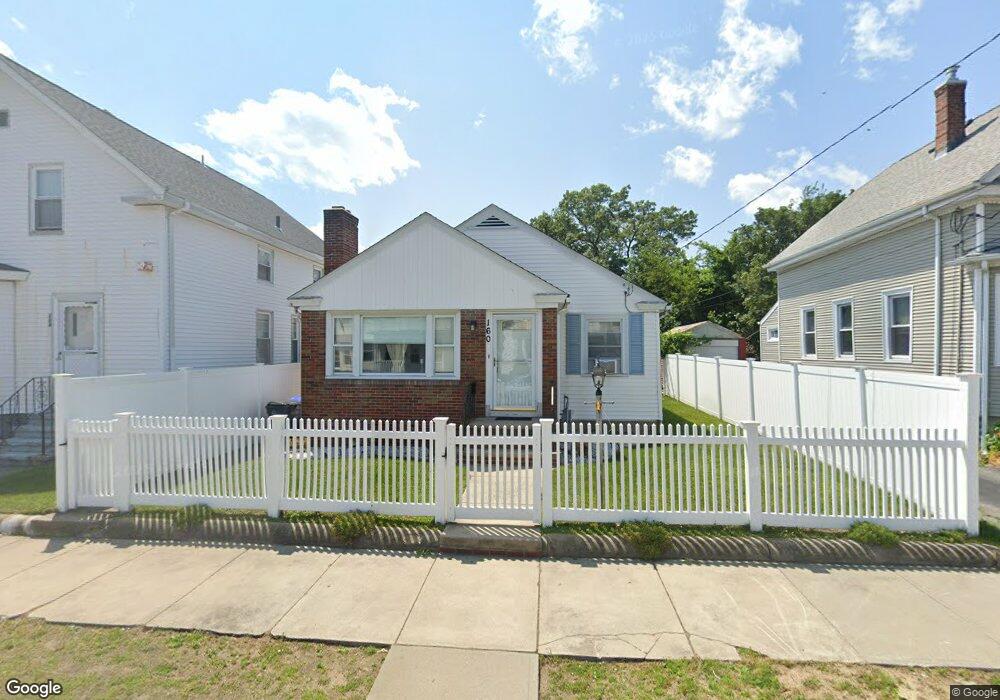
160 Langdon St Providence, RI 02904
Charles NeighborhoodEstimated Value: $355,000 - $443,000
3
Beds
2
Baths
1,304
Sq Ft
$312/Sq Ft
Est. Value
About This Home
This home is located at 160 Langdon St, Providence, RI 02904 and is currently estimated at $407,125, approximately $312 per square foot. 160 Langdon St is a home located in Providence County with nearby schools including Asa Messer Elementary School, Charles N. Fortes Elementary School, and Veazie Street Elementary School.
Ownership History
Date
Name
Owned For
Owner Type
Purchase Details
Closed on
Jan 4, 2025
Sold by
Berroa Magda
Bought by
Berroa Magda and Maldonado Jessper M
Current Estimated Value
Purchase Details
Closed on
May 27, 2016
Sold by
Volpe Delia and Volpe Stephen M
Bought by
Berroa Magda
Home Financials for this Owner
Home Financials are based on the most recent Mortgage that was taken out on this home.
Original Mortgage
$116,503
Interest Rate
3.25%
Mortgage Type
FHA
Purchase Details
Closed on
Jan 11, 1994
Sold by
Landi Anthony
Bought by
Volpe Ronald and Volpe Delia
Create a Home Valuation Report for This Property
The Home Valuation Report is an in-depth analysis detailing your home's value as well as a comparison with similar homes in the area
Home Values in the Area
Average Home Value in this Area
Purchase History
| Date | Buyer | Sale Price | Title Company |
|---|---|---|---|
| Berroa Magda | -- | None Available | |
| Berroa Magda | -- | None Available | |
| Berroa Magda | -- | None Available | |
| Berroa Magda | $130,000 | -- | |
| Berroa Magda | $130,000 | -- | |
| Berroa Magda | $130,000 | -- | |
| Volpe Ronald | $45,000 | -- | |
| Volpe Ronald | $45,000 | -- |
Source: Public Records
Mortgage History
| Date | Status | Borrower | Loan Amount |
|---|---|---|---|
| Previous Owner | Berroa Magda | $116,503 |
Source: Public Records
Tax History Compared to Growth
Tax History
| Year | Tax Paid | Tax Assessment Tax Assessment Total Assessment is a certain percentage of the fair market value that is determined by local assessors to be the total taxable value of land and additions on the property. | Land | Improvement |
|---|---|---|---|---|
| 2025 | $3,038 | $361,700 | $128,000 | $233,700 |
| 2024 | $5,202 | $283,500 | $84,000 | $199,500 |
| 2023 | $5,202 | $283,500 | $84,000 | $199,500 |
| 2022 | $5,046 | $283,500 | $84,000 | $199,500 |
| 2021 | $4,568 | $186,000 | $61,000 | $125,000 |
| 2020 | $4,568 | $186,000 | $61,000 | $125,000 |
| 2019 | $4,568 | $186,000 | $61,000 | $125,000 |
| 2018 | $4,705 | $147,200 | $47,100 | $100,100 |
| 2017 | $4,628 | $144,800 | $47,100 | $97,700 |
| 2016 | $4,628 | $144,800 | $47,100 | $97,700 |
| 2015 | $4,194 | $126,700 | $47,700 | $79,000 |
| 2014 | $4,276 | $126,700 | $47,700 | $79,000 |
| 2013 | $4,276 | $126,700 | $47,700 | $79,000 |
Source: Public Records
Map
Nearby Homes
- 162 Langdon St
- 154 Langdon St
- 170 Langdon St
- 11 Newbury St
- 174 Langdon St
- 12 Manhattan St
- 2 Manhattan St
- 15 Newbury St
- 150 Langdon St
- 159 Langdon St Unit 161
- 167 Langdon St
- 26 Manhattan St
- 155 Langdon St
- 173 Langdon St
- 146 Langdon St
- 16 Newbury St
- 15 Manhattan St
- 28 Manhattan St
- 147 Langdon St
- 20 Newbury St