Estimated Value: $478,341 - $542,000
3
Beds
2
Baths
1,333
Sq Ft
$379/Sq Ft
Est. Value
About This Home
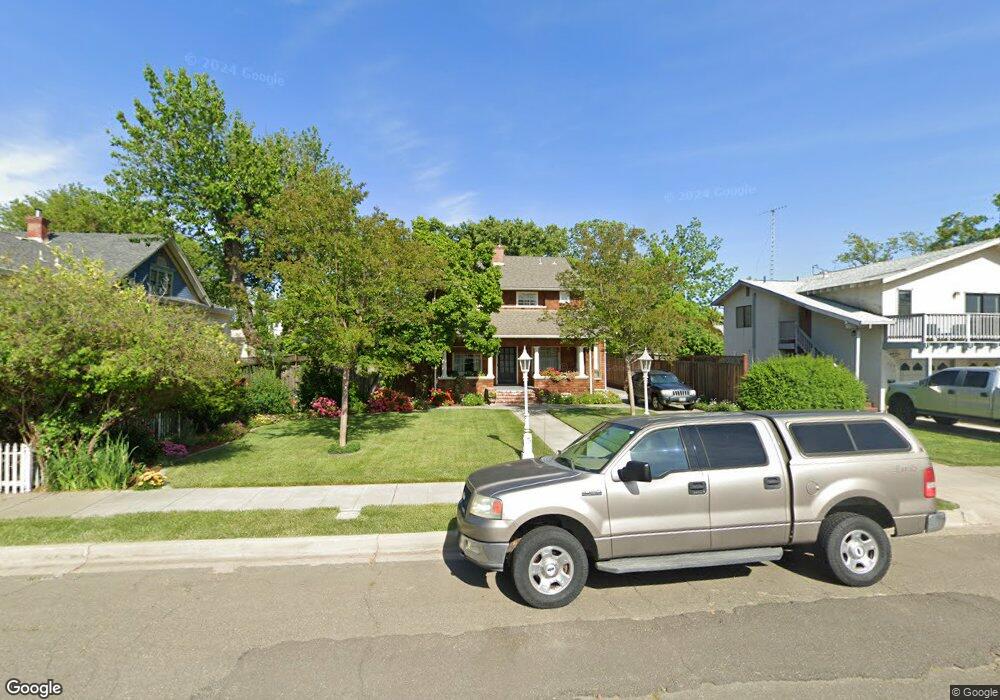
This home is located at 160 N 3rd St, Dixon, CA 95620 and is currently estimated at $504,585, approximately $378 per square foot. 160 N 3rd St is a home located in Solano County with nearby schools including Anderson (Linford L.) Elementary School, Dixon High School, and Dixon Montessori Charter.
Ownership History
Date
Name
Owned For
Owner Type
Purchase Details
Closed on
Oct 12, 2020
Sold by
Pinaglia Donald B and Pinaglia Barbara D
Bought by
Pinaglia Donald B and Pinaglia Barbara D
Current Estimated Value
Home Financials for this Owner
Home Financials are based on the most recent Mortgage that was taken out on this home.
Original Mortgage
$159,000
Outstanding Balance
$141,422
Interest Rate
2.9%
Mortgage Type
New Conventional
Estimated Equity
$363,163
Purchase Details
Closed on
Feb 2, 2018
Sold by
Pinaglia Donald B and Pinaglia Barbara D
Bought by
Pinaglia Donald B and Pinaglia Barbara D
Home Financials for this Owner
Home Financials are based on the most recent Mortgage that was taken out on this home.
Original Mortgage
$162,000
Interest Rate
3.94%
Mortgage Type
New Conventional
Purchase Details
Closed on
Feb 1, 2018
Sold by
Pinaglia Donald B and Pinaglia Barbara D
Bought by
Pinaglia Donald B and Pinaglia Barbara D
Home Financials for this Owner
Home Financials are based on the most recent Mortgage that was taken out on this home.
Original Mortgage
$162,000
Interest Rate
3.94%
Mortgage Type
New Conventional
Purchase Details
Closed on
Sep 8, 2004
Sold by
Pinaglia Donald B and Pinaglia Barbara D
Bought by
Pinaglia Donald B and Pinaglia Barbara D
Purchase Details
Closed on
Dec 17, 1993
Sold by
Cash Eleanor L
Bought by
Pinaglia Donald B and Pinaglia Barbara D
Home Financials for this Owner
Home Financials are based on the most recent Mortgage that was taken out on this home.
Original Mortgage
$156,060
Interest Rate
7.2%
Mortgage Type
Assumption
Create a Home Valuation Report for This Property
The Home Valuation Report is an in-depth analysis detailing your home's value as well as a comparison with similar homes in the area
Home Values in the Area
Average Home Value in this Area
Purchase History
| Date | Buyer | Sale Price | Title Company |
|---|---|---|---|
| Pinaglia Donald B | -- | Fidelity National Title Co | |
| Pinaglia Donald B | -- | Fidelity National Title Co | |
| Pinaglia Donald B | -- | Fidelity National Title Co | |
| Pinaglia Donald B | -- | Fidelity National Title Co | |
| Pinaglia Donald B | -- | Fidelity National Title Co | |
| Pinaglia Donald B | -- | -- | |
| Pinaglia Donald B | $180,000 | North American Title Co Inc |
Source: Public Records
Mortgage History
| Date | Status | Borrower | Loan Amount |
|---|---|---|---|
| Open | Pinaglia Donald B | $159,000 | |
| Closed | Pinaglia Donald B | $162,000 | |
| Previous Owner | Pinaglia Donald B | $156,060 |
Source: Public Records
Tax History
| Year | Tax Paid | Tax Assessment Tax Assessment Total Assessment is a certain percentage of the fair market value that is determined by local assessors to be the total taxable value of land and additions on the property. | Land | Improvement |
|---|---|---|---|---|
| 2025 | $3,316 | $305,943 | $118,977 | $186,966 |
| 2024 | $3,316 | $299,945 | $116,645 | $183,300 |
| 2023 | $3,216 | $294,064 | $114,358 | $179,706 |
| 2022 | $3,168 | $288,299 | $112,116 | $176,183 |
| 2021 | $3,128 | $282,647 | $109,918 | $172,729 |
| 2020 | $3,077 | $279,749 | $108,791 | $170,958 |
| 2019 | $3,018 | $274,264 | $106,658 | $167,606 |
| 2018 | $3,005 | $268,887 | $104,567 | $164,320 |
| 2017 | $2,929 | $263,616 | $102,517 | $161,099 |
| 2016 | $2,797 | $258,448 | $100,507 | $157,941 |
| 2015 | $2,731 | $254,567 | $98,998 | $155,569 |
| 2014 | $2,701 | $249,581 | $97,059 | $152,522 |
Source: Public Records
Map
Nearby Homes
Your Personal Tour Guide
Ask me questions while you tour the home.