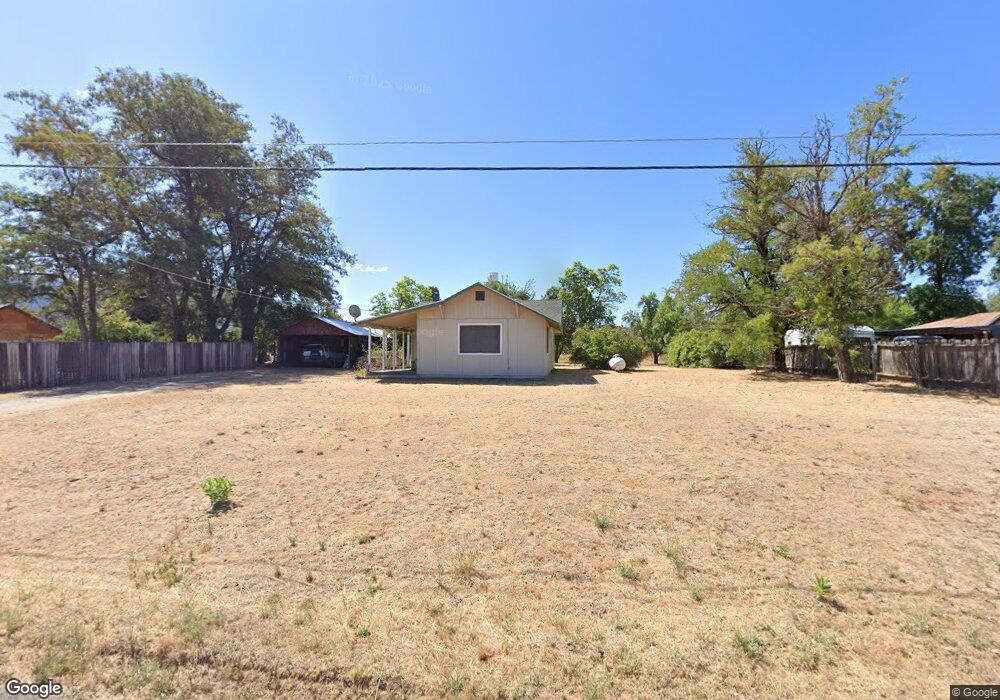
160 Riverview Rd Hayfork, CA 96041
Estimated Value: $122,000 - $198,000
2
Beds
1
Bath
984
Sq Ft
$153/Sq Ft
Est. Value
About This Home
This home is located at 160 Riverview Rd, Hayfork, CA 96041 and is currently estimated at $150,131, approximately $152 per square foot. 160 Riverview Rd is a home with nearby schools including Hayfork High School.
Ownership History
Date
Name
Owned For
Owner Type
Purchase Details
Closed on
Feb 21, 2018
Sold by
Simons Dusty R
Bought by
Mcdonald V James E
Current Estimated Value
Purchase Details
Closed on
Jan 19, 2017
Sold by
Jones Linda
Bought by
Jones Linda S and Simons Dusty R
Purchase Details
Closed on
May 13, 2013
Sold by
Jones Linda
Bought by
Mcdonald James E
Purchase Details
Closed on
Mar 31, 2010
Sold by
Jones Hiram and Jones Linda
Bought by
Jones Hiram and Jones Linda
Create a Home Valuation Report for This Property
The Home Valuation Report is an in-depth analysis detailing your home's value as well as a comparison with similar homes in the area
Home Values in the Area
Average Home Value in this Area
Purchase History
| Date | Buyer | Sale Price | Title Company |
|---|---|---|---|
| Mcdonald V James E | -- | None Available | |
| Jones Linda S | -- | None Available | |
| Mcdonald James E | $14,000 | Trinity Co Title Co | |
| Jones Hiram | -- | Trinity Co Title Co |
Source: Public Records
Tax History
| Year | Tax Paid | Tax Assessment Tax Assessment Total Assessment is a certain percentage of the fair market value that is determined by local assessors to be the total taxable value of land and additions on the property. | Land | Improvement |
|---|---|---|---|---|
| 2025 | $348 | $25,086 | $4,642 | $20,444 |
| 2024 | $344 | $24,595 | $4,551 | $20,044 |
| 2023 | $344 | $24,113 | $4,462 | $19,651 |
| 2022 | $338 | $23,641 | $4,375 | $19,266 |
| 2021 | $322 | $23,179 | $4,290 | $18,889 |
| 2020 | $277 | $22,943 | $4,247 | $18,696 |
| 2019 | $272 | $22,494 | $4,164 | $18,330 |
| 2018 | $280 | $22,054 | $4,083 | $17,971 |
| 2017 | $338 | $21,622 | $4,003 | $17,619 |
| 2016 | $329 | $21,199 | $3,925 | $17,274 |
| 2015 | $326 | $20,882 | $3,867 | $17,015 |
| 2014 | $324 | $20,474 | $3,792 | $16,682 |
Source: Public Records
Map
Nearby Homes
- 71 Tule Creek Rd
- 7020 California 3
- 7021 California 3
- 134 W Humboldt St
- 134 Humboldt St
- 675 Hyampom
- 305 Pine Ave
- 355 Pine Ave
- 70 Oak Ave
- 125 Cedar Gulch Rd
- 1240 Morgan Hill Rd
- 63 Michel St
- 820 Kingsbury Rd
- 1095 Hyampom Rd
- 310 Reservoir Rd
- 355 Oliva Dr
- 480 Oliva Dr
- 420 Oliva Dr
- 20 Genest St
- 120 Hardy Ln
- 140 Riverview Rd
- 170 Riverview Rd
- 100 Riverview Rd
- 86 Riverview Rd
- 202 Riverview Rd
- 66 Riverview Rd
- 52 Riverview Rd
- 260 Riverview Rd
- 202 Clinic Ave
- 201 Clinic Ave
- 294 Riverview Rd
- 70 Clinic Ave
- 6620 State Highway 3
- 6621 California 3
- 91 School Ave
- 111 School Ave
- 366 Riverview Rd
- 6231 State Highway 3
- 150 Main St
Your Personal Tour Guide
Ask me questions while you tour the home.