
Seller's Agent in 2018
Michelle Tucker
Platinum Properties
(912) 247-7886
2 Total Sales
Estimated Value: $311,332 - $324,000
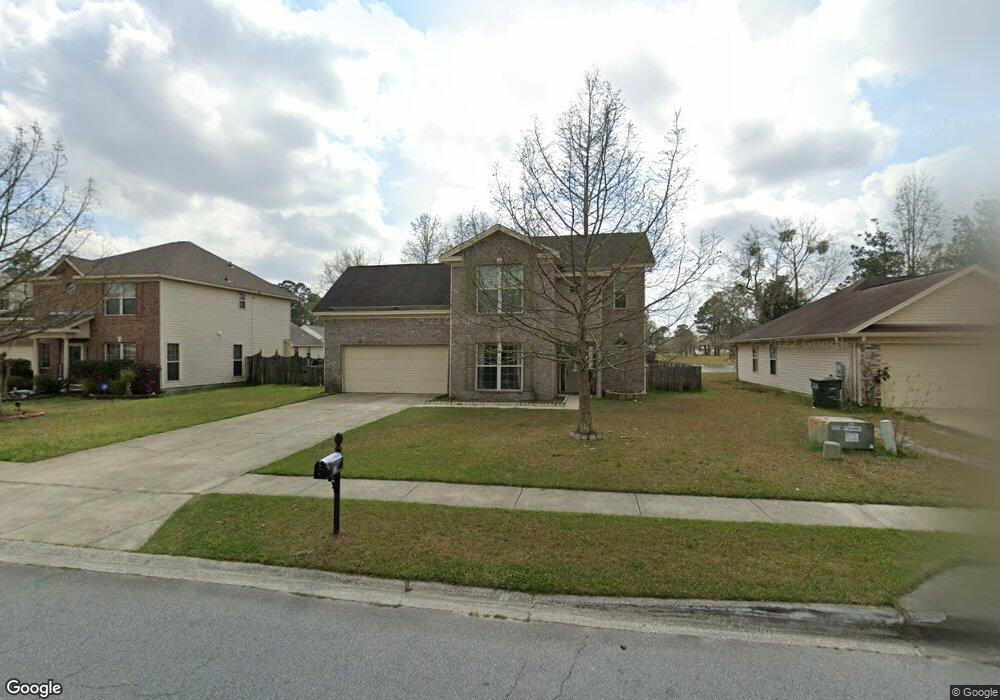
Centrally located to downtown historic Savannah, Pooler, Hunter Army Airfield, I-95 and I-16, this two story home is nestled on lagoon waterfront in Salt Creek Landing. Featuring 1800+ sq ft. of living, 3 bedrooms, BONUS room, 2 ½ baths, living room, separate dining room, cherry finish cabinets with hard surface counter tops in the kitchen, pantry and eat-in kitchen area overlooking the lagoon in the backyard. Large private master bath with dual vanities, linen storage and over sized walk-in closet. Move-in ready with fresh paint and new carpets. Fenced in backyard, double garage with automatic opener. Community highlights : sidewalks, streetlights, pool and playground.
| Date | Buyer | Sale Price | Title Company |
|---|---|---|---|
| Keele Tiana | $172,900 | -- | |
| Joiner Mason L | $169,000 | -- |
| Date | Status | Borrower | Loan Amount |
|---|---|---|---|
| Open | Keele Tiana | $169,767 | |
| Previous Owner | Joiner Mason L | $174,504 |
| Date | Event | Price | List to Sale | Price per Sq Ft | Prior Sale |
|---|---|---|---|---|---|
| 07/31/2018 07/31/18 | Sold | $172,900 | -3.9% | $96 / Sq Ft | View Prior Sale |
| 06/05/2018 06/05/18 | Pending | -- | -- | -- | |
| 05/29/2018 05/29/18 | For Sale | $180,000 | 0.0% | $100 / Sq Ft | |
| 01/09/2015 01/09/15 | Rented | $1,200 | 0.0% | -- | |
| 01/09/2015 01/09/15 | Under Contract | -- | -- | -- | |
| 10/15/2014 10/15/14 | For Rent | $1,200 | 0.0% | -- | |
| 11/12/2012 11/12/12 | Rented | $1,200 | -14.3% | -- | |
| 11/11/2012 11/11/12 | Under Contract | -- | -- | -- | |
| 07/23/2012 07/23/12 | For Rent | $1,400 | -- | -- |
| Year | Tax Paid | Tax Assessment Tax Assessment Total Assessment is a certain percentage of the fair market value that is determined by local assessors to be the total taxable value of land and additions on the property. | Land | Improvement |
|---|---|---|---|---|
| 2025 | $2,347 | $114,760 | $20,000 | $94,760 |
| 2024 | $2,347 | $113,960 | $20,000 | $93,960 |
| 2023 | $1,551 | $94,640 | $12,000 | $82,640 |
| 2022 | $1,976 | $86,640 | $12,000 | $74,640 |
| 2021 | $2,085 | $69,600 | $6,000 | $63,600 |
| 2020 | $1,986 | $67,480 | $6,000 | $61,480 |
| 2019 | $2,109 | $62,800 | $6,000 | $56,800 |
| 2018 | $2,050 | $60,640 | $6,000 | $54,640 |
| 2017 | $2,006 | $61,040 | $6,000 | $55,040 |
| 2016 | $2,088 | $60,240 | $6,000 | $54,240 |
| 2015 | $2,114 | $60,920 | $6,000 | $54,920 |
| 2014 | $3,149 | $62,680 | $0 | $0 |
Seller's Agent in 2018
Michelle Tucker
Platinum Properties
(912) 247-7886
2 Total Sales
Buyer's Agent in 2018
Curtisha Pinckney
Keller Williams Coastal Area P
(912) 224-8617
22 Total Sales