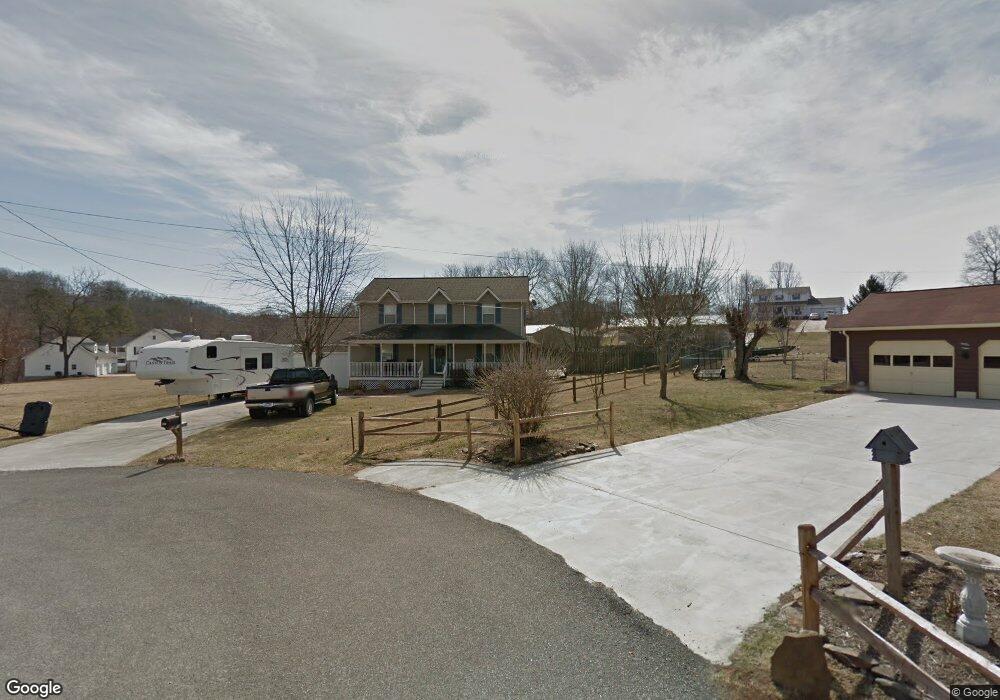
160 Stones Ln Jacksboro, TN 37757
Estimated Value: $315,000 - $382,000
--
Bed
2
Baths
1,976
Sq Ft
$179/Sq Ft
Est. Value
About This Home
This home is located at 160 Stones Ln, Jacksboro, TN 37757 and is currently estimated at $353,194, approximately $178 per square foot. 160 Stones Ln is a home located in Campbell County.
Ownership History
Date
Name
Owned For
Owner Type
Purchase Details
Closed on
Dec 14, 2004
Sold by
Gladson Donald R and Gladson Lockye
Bought by
Dabney Travis and Dabney Amanda J
Current Estimated Value
Purchase Details
Closed on
Jul 29, 2004
Bought by
Gladson Donald R and Gladson Lockye J
Purchase Details
Closed on
Jul 7, 1991
Bought by
Melton Gary Wayne and Patricia Ann
Purchase Details
Closed on
Mar 29, 1991
Bought by
Hall Robert and Lee Ann
Purchase Details
Closed on
Jun 1, 1990
Bought by
Stokes Charles
Create a Home Valuation Report for This Property
The Home Valuation Report is an in-depth analysis detailing your home's value as well as a comparison with similar homes in the area
Home Values in the Area
Average Home Value in this Area
Purchase History
| Date | Buyer | Sale Price | Title Company |
|---|---|---|---|
| Dabney Travis | $128,900 | -- | |
| Gladson Donald R | $121,500 | -- | |
| Melton Gary Wayne | $69,000 | -- | |
| Hall Robert | -- | -- | |
| Stokes Charles | $8,100 | -- |
Source: Public Records
Tax History Compared to Growth
Tax History
| Year | Tax Paid | Tax Assessment Tax Assessment Total Assessment is a certain percentage of the fair market value that is determined by local assessors to be the total taxable value of land and additions on the property. | Land | Improvement |
|---|---|---|---|---|
| 2024 | $1,092 | $89,800 | $13,200 | $76,600 |
| 2023 | $882 | $42,700 | $4,500 | $38,200 |
| 2022 | $882 | $42,700 | $4,500 | $38,200 |
| 2021 | $882 | $42,700 | $4,500 | $38,200 |
| 2020 | $864 | $42,700 | $4,500 | $38,200 |
| 2019 | $882 | $42,700 | $4,500 | $38,200 |
| 2018 | $794 | $35,275 | $4,950 | $30,325 |
| 2017 | $794 | $35,275 | $4,950 | $30,325 |
| 2016 | $794 | $35,275 | $4,950 | $30,325 |
| 2015 | $702 | $35,275 | $4,950 | $30,325 |
| 2014 | -- | $35,275 | $4,950 | $30,325 |
| 2013 | -- | $35,275 | $4,950 | $30,325 |
Source: Public Records
Map
Nearby Homes
- 121 Stones Ln
- 327 Cedar Cir
- 171 Forest Cove Ct
- 117 Pierce Rd
- 300 Bluff Trace
- 221 Kay Springs Cir
- 398 Perry Smith Ln
- 211 Timberlake Cir
- 359 McDeerman Rd
- 377 Clear Lake Dr
- 0 Storm Ln Unit 1307847
- 237 Lakemont Ln
- 348 Ridge Rd
- Lot 14 Foxwood Dr
- 1411 Ridge Rd
- 281 Red Oak Cir
- 112 Margaret Ln
- 0 Hiawatha Ln
- 1566 Lakewood Rd
- 107 Bertha Ln
- 150 Stones Ln
- 169 Overlook Ln
- 161 Overlook Ln
- 181 Overlook Ln
- 143 Stones Ln
- 134 Stones Ln
- 175 Stones Ln
- 149 Overlook Ln
- 193 Overlook Ln
- 193 Overlook Ln
- 135 Overlook Ln
- 131 Stones Ln
- 124 Stones Ln
- 180 Overlook Ln
- 127 Overlook Ln
- 190 Overlook Ln
- 209 Overlook Ln
- 168 Overlook Ln
- 158 Overlook Ln
- 210 Overlook Ln