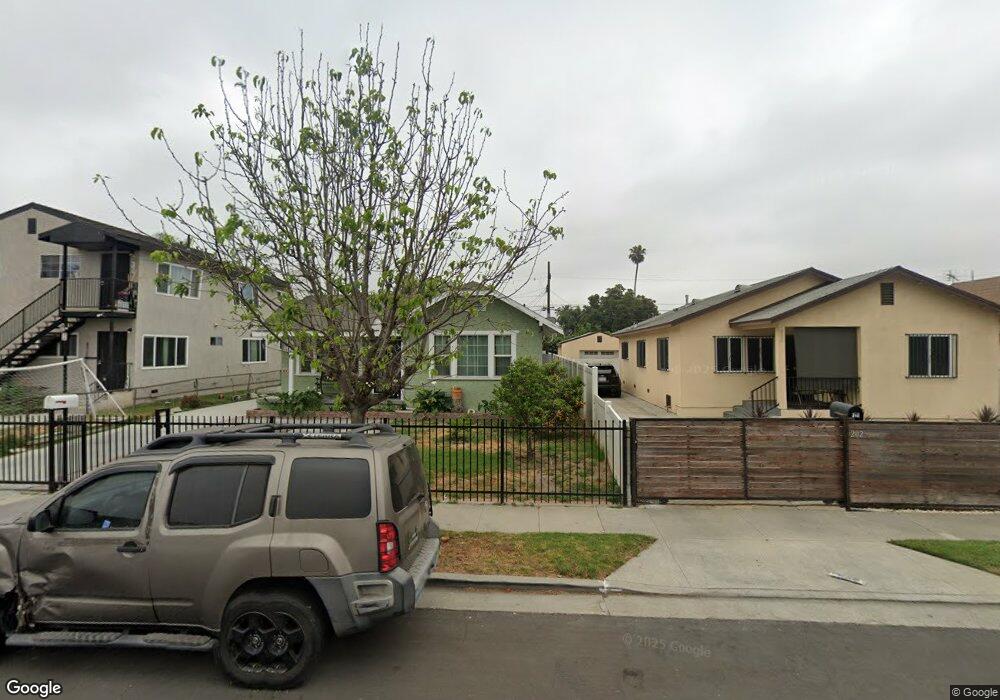
160 W 73rd St Los Angeles, CA 90003
Florence NeighborhoodEstimated Value: $662,960 - $792,000
3
Beds
2
Baths
1,252
Sq Ft
$571/Sq Ft
Est. Value
About This Home
This home is located at 160 W 73rd St, Los Angeles, CA 90003 and is currently estimated at $714,990, approximately $571 per square foot. 160 W 73rd St is a home located in Los Angeles County with nearby schools including Seventy-Fifth Street Elementary School, Mary McLeod Bethune Middle School, and Academy For Multiligual Arts And Science At Mervyn M. Dymally High.
Ownership History
Date
Name
Owned For
Owner Type
Purchase Details
Closed on
Mar 2, 2017
Sold by
Gonzalez Patricia
Bought by
Aceves Salvador Gonzalez
Current Estimated Value
Home Financials for this Owner
Home Financials are based on the most recent Mortgage that was taken out on this home.
Original Mortgage
$230,000
Outstanding Balance
$190,249
Interest Rate
4.08%
Mortgage Type
New Conventional
Estimated Equity
$524,741
Purchase Details
Closed on
Sep 25, 1995
Sold by
Cogbill Socorro and The Cogbill Trust
Bought by
Aceves Salvador Gonzalez and Gonzalez Patricia
Home Financials for this Owner
Home Financials are based on the most recent Mortgage that was taken out on this home.
Original Mortgage
$118,201
Interest Rate
7.8%
Mortgage Type
FHA
Create a Home Valuation Report for This Property
The Home Valuation Report is an in-depth analysis detailing your home's value as well as a comparison with similar homes in the area
Home Values in the Area
Average Home Value in this Area
Purchase History
| Date | Buyer | Sale Price | Title Company |
|---|---|---|---|
| Aceves Salvador Gonzalez | -- | Old Republic Title Company | |
| Aceves Salvador Gonzalez | $119,000 | Stewart Title |
Source: Public Records
Mortgage History
| Date | Status | Borrower | Loan Amount |
|---|---|---|---|
| Open | Aceves Salvador Gonzalez | $230,000 | |
| Closed | Aceves Salvador Gonzalez | $118,201 |
Source: Public Records
Tax History Compared to Growth
Tax History
| Year | Tax Paid | Tax Assessment Tax Assessment Total Assessment is a certain percentage of the fair market value that is determined by local assessors to be the total taxable value of land and additions on the property. | Land | Improvement |
|---|---|---|---|---|
| 2025 | $2,555 | $197,659 | $132,886 | $64,773 |
| 2024 | $2,555 | $193,784 | $130,281 | $63,503 |
| 2023 | $2,509 | $189,985 | $127,727 | $62,258 |
| 2022 | $2,398 | $186,261 | $125,223 | $61,038 |
| 2021 | $2,363 | $182,610 | $122,768 | $59,842 |
| 2020 | $2,381 | $180,739 | $121,510 | $59,229 |
| 2019 | $2,295 | $177,196 | $119,128 | $58,068 |
| 2018 | $2,207 | $173,723 | $116,793 | $56,930 |
| 2016 | $2,097 | $166,978 | $112,258 | $54,720 |
| 2015 | $2,068 | $164,471 | $110,572 | $53,899 |
| 2014 | $2,086 | $161,251 | $108,407 | $52,844 |
Source: Public Records
Map
Nearby Homes