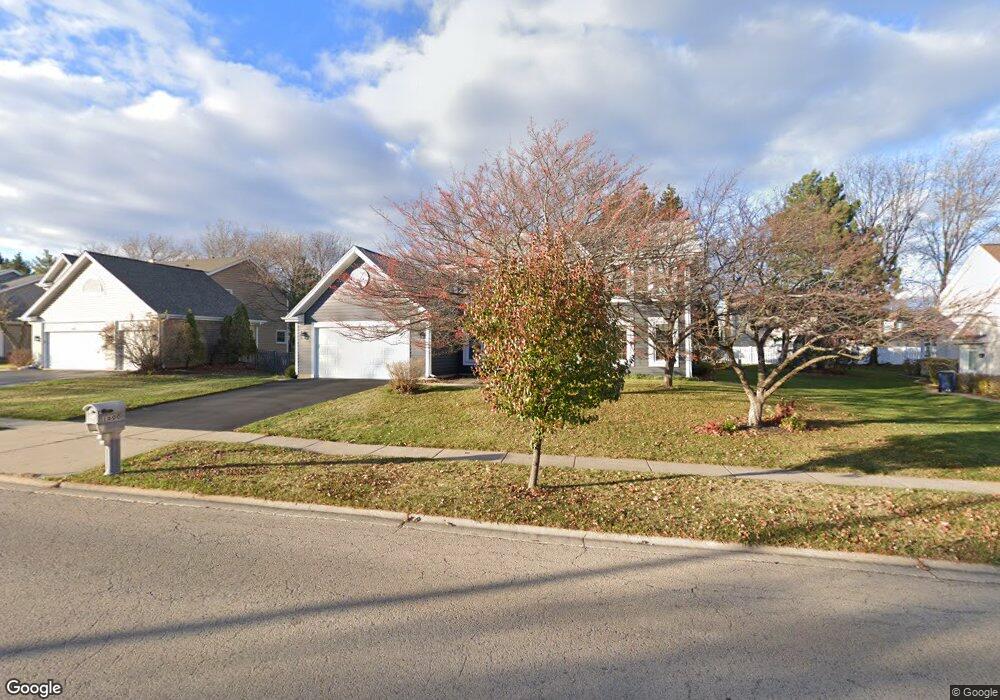
1600 Huntington Dr N Algonquin, IL 60102
Estimated Value: $382,956 - $489,000
4
Beds
3
Baths
2,283
Sq Ft
$194/Sq Ft
Est. Value
About This Home
This home is located at 1600 Huntington Dr N, Algonquin, IL 60102 and is currently estimated at $442,489, approximately $193 per square foot. 1600 Huntington Dr N is a home located in McHenry County with nearby schools including Westfield Community School, United Junior High School, and Harry D Jacobs High School.
Ownership History
Date
Name
Owned For
Owner Type
Purchase Details
Closed on
Nov 5, 2025
Sold by
Smetters Nancy Kay
Bought by
Nancy Kay Smetters Living Trust and Smetters
Current Estimated Value
Create a Home Valuation Report for This Property
The Home Valuation Report is an in-depth analysis detailing your home's value as well as a comparison with similar homes in the area
Home Values in the Area
Average Home Value in this Area
Purchase History
| Date | Buyer | Sale Price | Title Company |
|---|---|---|---|
| Nancy Kay Smetters Living Trust | -- | None Listed On Document |
Source: Public Records
Tax History Compared to Growth
Tax History
| Year | Tax Paid | Tax Assessment Tax Assessment Total Assessment is a certain percentage of the fair market value that is determined by local assessors to be the total taxable value of land and additions on the property. | Land | Improvement |
|---|---|---|---|---|
| 2024 | $4,410 | $118,424 | $23,082 | $95,342 |
| 2023 | $4,719 | $105,915 | $20,644 | $85,271 |
| 2022 | $5,263 | $109,906 | $27,952 | $81,954 |
| 2021 | $5,445 | $102,391 | $26,041 | $76,350 |
| 2020 | $5,511 | $98,766 | $25,119 | $73,647 |
| 2019 | $5,635 | $94,531 | $24,042 | $70,489 |
| 2018 | $5,849 | $87,327 | $22,210 | $65,117 |
| 2017 | $6,111 | $82,267 | $20,923 | $61,344 |
| 2016 | $6,453 | $77,159 | $19,624 | $57,535 |
| 2013 | -- | $73,630 | $18,308 | $55,322 |
Source: Public Records
Map
Nearby Homes
- 135 Arquilla Dr
- 266 Grandview Ct
- Lots 10 & 11 Ramble Rd
- 16 Brian Ct
- 305 Buckingham Dr
- LOT 3 Blackhawk Dr
- 909 Roger St
- 1235 Fairmont Ct
- 700 Fairfield Ln
- 661 Majestic Dr
- 807 Menominee Dr
- 809 Menominee Dr
- 113 Pheasant Trail
- 741 Regal Ln
- 1820 Crofton Dr
- 101 Oakleaf Rd
- 721 Brentwood Ct
- 900 Windstone Ct
- 70 Hilltop Dr Unit 4
- 937 Mesa Dr
- 1610 Huntington Dr N
- 1500 Huntington Dr N
- 1547 Arquilla Dr
- 1537 Arquilla Dr
- 1557 Arquilla Dr
- 1620 Huntington Dr N
- 301 Fieldcrest Dr
- 1527 Arquilla Dr
- 1567 Arquilla Dr
- 300 Farmhill Ct
- 1630 Huntington Dr N
- 300 Fieldcrest Dr
- 311 Fieldcrest Dr
- 310 Farmhill Ct
- 1640 Huntington Dr N
- 310 Fieldcrest Dr
- 1542 Arquilla Dr
- 1552 Arquilla Dr
- 1587 Arquilla Dr
- 1532 Arquilla Dr