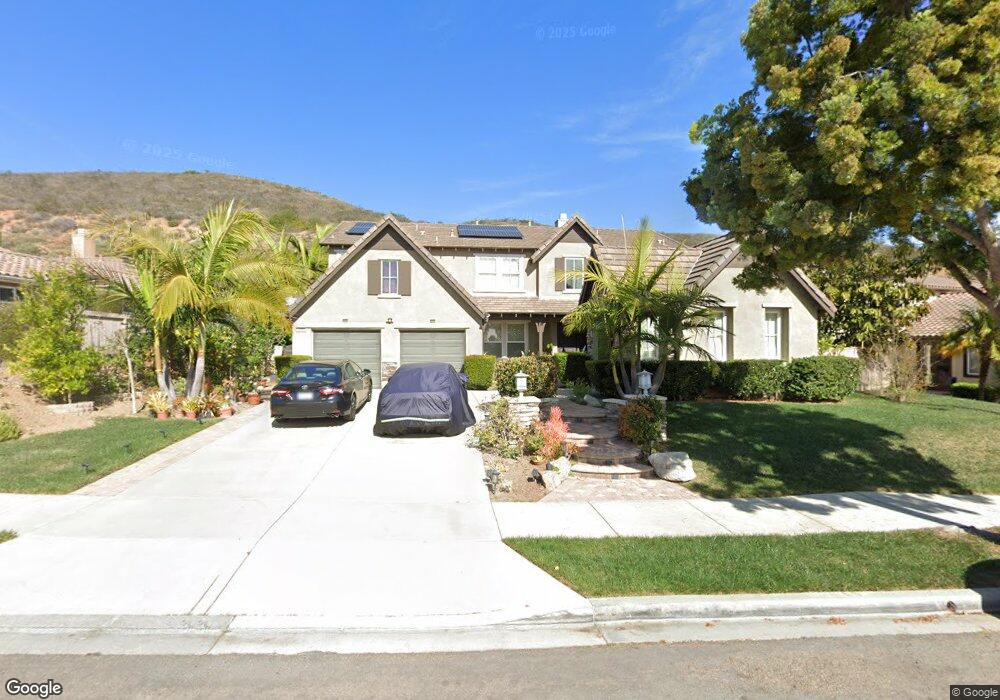
16005 Cayenne Ridge Rd San Diego, CA 92127
4S Ranch NeighborhoodEstimated Value: $2,422,000 - $2,542,000
5
Beds
5
Baths
3,802
Sq Ft
$649/Sq Ft
Est. Value
About This Home
This home is located at 16005 Cayenne Ridge Rd, San Diego, CA 92127 and is currently estimated at $2,469,041, approximately $649 per square foot. 16005 Cayenne Ridge Rd is a home located in San Diego County with nearby schools including Stone Ranch Elementary, Oak Valley Middle, and Del Norte High School.
Ownership History
Date
Name
Owned For
Owner Type
Purchase Details
Closed on
Mar 13, 2023
Sold by
Dela Cruz Nanie S
Bought by
Dela Cruz Family Trust
Current Estimated Value
Purchase Details
Closed on
Jun 17, 2008
Sold by
Cruz Eleno Tomines Dela
Bought by
Dela Cruz Eleno Tomines and Dela Cruz Nanie Soriano
Purchase Details
Closed on
Mar 18, 2004
Sold by
Standard Pacific Corp
Bought by
Delacruz Eleno T and Delacruz Nanie S
Home Financials for this Owner
Home Financials are based on the most recent Mortgage that was taken out on this home.
Original Mortgage
$637,875
Interest Rate
6.29%
Mortgage Type
Stand Alone First
Purchase Details
Closed on
Jul 15, 2003
Sold by
4S Kelwood General Partnership
Bought by
Standard Pacific Corp
Create a Home Valuation Report for This Property
The Home Valuation Report is an in-depth analysis detailing your home's value as well as a comparison with similar homes in the area
Home Values in the Area
Average Home Value in this Area
Purchase History
| Date | Buyer | Sale Price | Title Company |
|---|---|---|---|
| Dela Cruz Family Trust | -- | -- | |
| Dela Cruz Eleno Tomines | -- | None Available | |
| Delacruz Eleno T | $850,500 | Chicago Title Co | |
| Standard Pacific Corp | -- | Chicago Title |
Source: Public Records
Mortgage History
| Date | Status | Borrower | Loan Amount |
|---|---|---|---|
| Previous Owner | Delacruz Eleno T | $637,875 | |
| Closed | Standard Pacific Corp | $0 |
Source: Public Records
Tax History Compared to Growth
Tax History
| Year | Tax Paid | Tax Assessment Tax Assessment Total Assessment is a certain percentage of the fair market value that is determined by local assessors to be the total taxable value of land and additions on the property. | Land | Improvement |
|---|---|---|---|---|
| 2025 | $20,376 | $1,199,173 | $487,861 | $711,312 |
| 2024 | $20,376 | $1,175,661 | $478,296 | $697,365 |
| 2023 | $18,143 | $1,130,011 | $459,724 | $670,287 |
| 2022 | $18,332 | $1,130,011 | $459,724 | $670,287 |
| 2021 | $17,973 | $1,107,855 | $450,710 | $657,145 |
| 2020 | $17,737 | $1,096,496 | $446,089 | $650,407 |
| 2019 | $18,760 | $1,074,997 | $437,343 | $637,654 |
| 2018 | $18,230 | $1,053,919 | $428,768 | $625,151 |
| 2017 | $17,785 | $1,033,255 | $420,361 | $612,894 |
| 2016 | $17,496 | $1,012,996 | $412,119 | $600,877 |
| 2015 | $17,194 | $997,781 | $405,929 | $591,852 |
| 2014 | $16,896 | $978,237 | $397,978 | $580,259 |
Source: Public Records
Map
Nearby Homes
- 15985 Camino Crisalida Unit 5
- 16115 Palomino Valley Ct
- 10832 Avenida de Los Lobos
- 15240 Cayenne Creek Ct
- 15273 Maturin Dr Unit 40
- 15283 Maturin Dr Unit 62
- 15267 Maturin Dr Unit 17
- 11251 Avenida de Los Lobos Unit D
- 10659 Paseo Allegria Ave
- 15373 Maturin Dr Unit 178
- 11183 Linares St
- 15576 Paseo Ajanta
- 15589 Paseo Jenghiz
- 15547 Paseo Jenghiz
- 0 Madrigal St Unit 144
- 15541 Paseo Jenghiz
- 16488 Fox Valley Dr
- 11385 Paseo Albacete
- 11378 Ajanta Ct
- 15447 van Lodensteyn Way
- 15993 Cayenne Ridge Rd
- 16013 Cayenne Ridge Rd
- 15985 Cayenne Ridge Rd
- 16004 Cayenne Ridge Rd
- 16012 Cayenne Ridge Rd
- 16029 Cayenne Ridge Rd
- 15992 Cayenne Ridge Rd
- 16020 Cayenne Ridge Rd
- 15984 Cayenne Ridge Rd
- 16028 Cayenne Ridge Rd
- 15977 Cayenne Ridge Rd
- 15976 Cayenne Ridge Rd
- 16036 Cayenne Ridge Rd
- 15315 Falcon Crest Ct
- 15303 Falcon Crest Ct
- 15327 Falcon Crest Ct
- 15271 Falcon Crest Ct
- 15339 Falcon Crest Ct
- 15968 Cayenne Ridge Rd
- 16044 Cayenne Ridge Rd