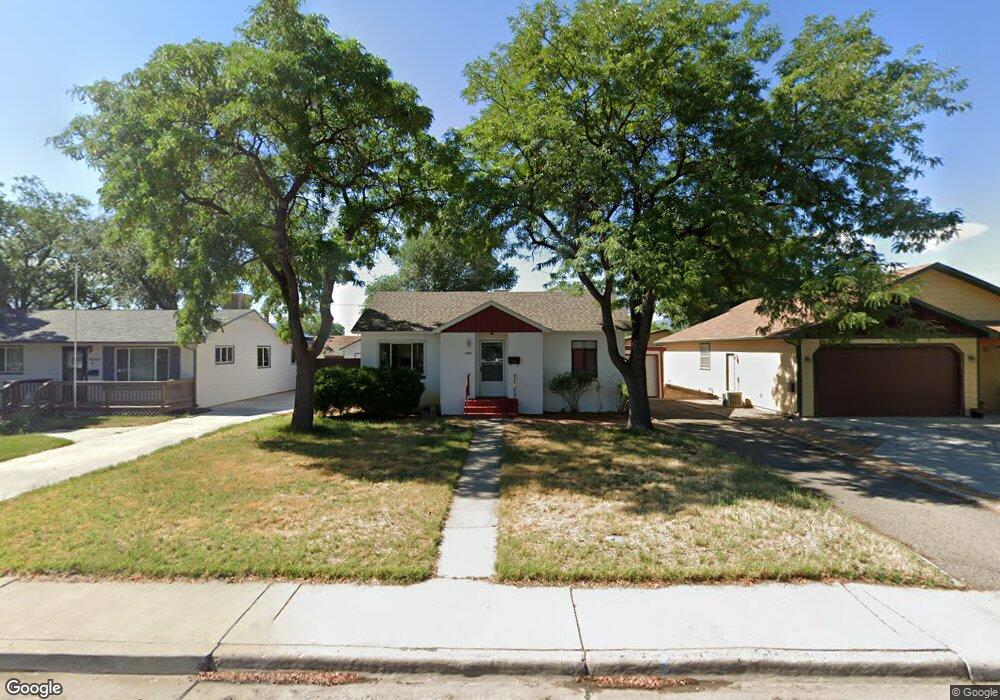
1601 Rood Ave Grand Junction, CO 81501
Downtown Grand Junction NeighborhoodEstimated Value: $259,000 - $296,207
2
Beds
1
Bath
836
Sq Ft
$340/Sq Ft
Est. Value
About This Home
This home is located at 1601 Rood Ave, Grand Junction, CO 81501 and is currently estimated at $284,552, approximately $340 per square foot. 1601 Rood Ave is a home located in Mesa County with nearby schools including Chipeta Elementary School, East Middle School, and West Middle School.
Ownership History
Date
Name
Owned For
Owner Type
Purchase Details
Closed on
Apr 16, 2020
Sold by
01 Rood Llc
Bought by
Kopperud Erik A
Current Estimated Value
Home Financials for this Owner
Home Financials are based on the most recent Mortgage that was taken out on this home.
Original Mortgage
$170,568
Outstanding Balance
$150,526
Interest Rate
3.2%
Mortgage Type
New Conventional
Estimated Equity
$134,026
Purchase Details
Closed on
Aug 22, 2007
Sold by
Jensen Dale W
Bought by
01 Rood Llc
Purchase Details
Closed on
Oct 9, 1992
Sold by
Willis Hazel M
Bought by
01 Rood Llc
Purchase Details
Closed on
Nov 5, 1990
Sold by
Green George L
Bought by
01 Rood Llc
Create a Home Valuation Report for This Property
The Home Valuation Report is an in-depth analysis detailing your home's value as well as a comparison with similar homes in the area
Home Values in the Area
Average Home Value in this Area
Purchase History
| Date | Buyer | Sale Price | Title Company |
|---|---|---|---|
| Kopperud Erik A | $189,520 | Land Title Guarantee | |
| 01 Rood Llc | -- | None Available | |
| 01 Rood Llc | $43,500 | -- | |
| 01 Rood Llc | $37,500 | -- |
Source: Public Records
Mortgage History
| Date | Status | Borrower | Loan Amount |
|---|---|---|---|
| Open | Kopperud Erik A | $170,568 |
Source: Public Records
Tax History Compared to Growth
Tax History
| Year | Tax Paid | Tax Assessment Tax Assessment Total Assessment is a certain percentage of the fair market value that is determined by local assessors to be the total taxable value of land and additions on the property. | Land | Improvement |
|---|---|---|---|---|
| 2024 | $940 | $13,290 | $4,460 | $8,830 |
| 2023 | $940 | $13,290 | $4,460 | $8,830 |
| 2022 | $917 | $12,720 | $4,520 | $8,200 |
| 2021 | $920 | $13,080 | $4,650 | $8,430 |
| 2020 | $761 | $11,070 | $3,580 | $7,490 |
| 2019 | $719 | $11,070 | $3,580 | $7,490 |
| 2018 | $737 | $10,410 | $3,240 | $7,170 |
| 2017 | $734 | $10,410 | $3,240 | $7,170 |
| 2016 | $550 | $8,770 | $3,380 | $5,390 |
| 2015 | $557 | $8,770 | $3,380 | $5,390 |
| 2014 | $503 | $7,970 | $2,790 | $5,180 |
Source: Public Records
Map
Nearby Homes