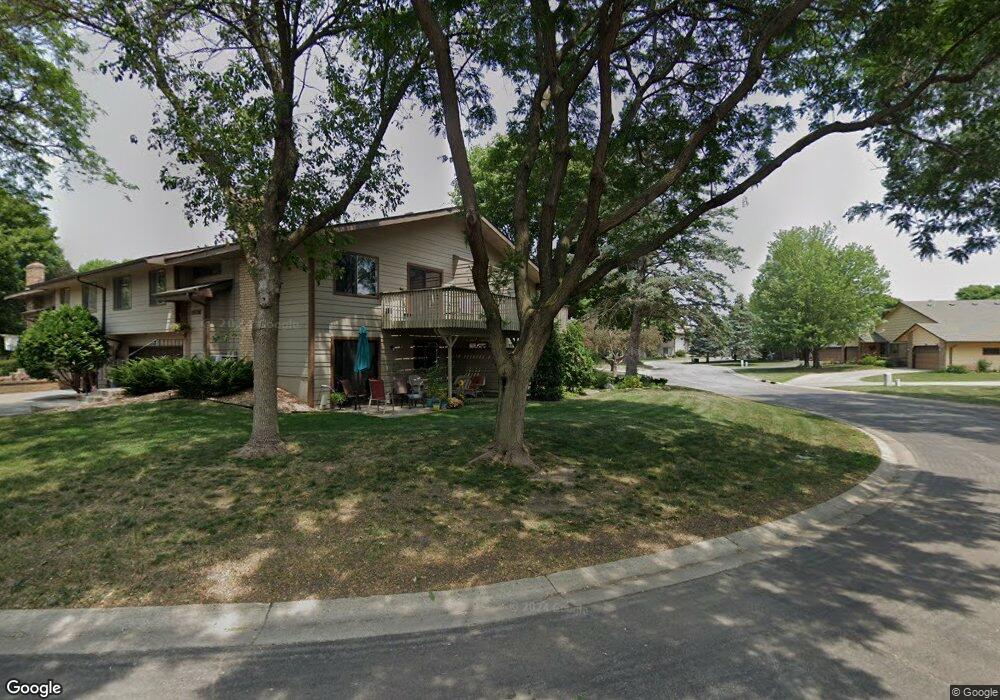
1602 Pheasantwood Trail Northfield, MN 55057
Estimated Value: $261,000 - $280,000
3
Beds
2
Baths
1,543
Sq Ft
$175/Sq Ft
Est. Value
About This Home
This home is located at 1602 Pheasantwood Trail, Northfield, MN 55057 and is currently estimated at $270,377, approximately $175 per square foot. 1602 Pheasantwood Trail is a home located in Rice County with nearby schools including Bridgewater Elementary School, Northfield Middle School, and Northfield Senior High School.
Ownership History
Date
Name
Owned For
Owner Type
Purchase Details
Closed on
Jul 11, 2022
Sold by
Kohl Jacob J and Kohl Bailey I
Bought by
Quistorff Derek
Current Estimated Value
Home Financials for this Owner
Home Financials are based on the most recent Mortgage that was taken out on this home.
Original Mortgage
$192,800
Outstanding Balance
$161,783
Interest Rate
4.32%
Mortgage Type
New Conventional
Estimated Equity
$108,594
Purchase Details
Closed on
Jul 23, 2019
Sold by
France Douglas C
Bought by
Kohl Jacob J and Auseth Bailey I
Home Financials for this Owner
Home Financials are based on the most recent Mortgage that was taken out on this home.
Original Mortgage
$167,500
Interest Rate
3.82%
Mortgage Type
New Conventional
Purchase Details
Closed on
Aug 17, 2007
Sold by
Lafond Mary G
Bought by
France Douglas C
Purchase Details
Closed on
Mar 28, 2003
Sold by
Phyllis J Ellingboe Revocable Trust
Bought by
Lafond Mary E
Create a Home Valuation Report for This Property
The Home Valuation Report is an in-depth analysis detailing your home's value as well as a comparison with similar homes in the area
Home Values in the Area
Average Home Value in this Area
Purchase History
| Date | Buyer | Sale Price | Title Company |
|---|---|---|---|
| Quistorff Derek | $241,000 | Prosperity First Title | |
| Kohl Jacob J | $177,500 | Knight Barry Ttl United Llc | |
| France Douglas C | $142,000 | -- | |
| Lafond Mary E | $148,000 | -- |
Source: Public Records
Mortgage History
| Date | Status | Borrower | Loan Amount |
|---|---|---|---|
| Open | Quistorff Derek | $192,800 | |
| Previous Owner | Kohl Jacob J | $167,500 |
Source: Public Records
Tax History Compared to Growth
Tax History
| Year | Tax Paid | Tax Assessment Tax Assessment Total Assessment is a certain percentage of the fair market value that is determined by local assessors to be the total taxable value of land and additions on the property. | Land | Improvement |
|---|---|---|---|---|
| 2025 | $3,756 | $236,200 | $48,600 | $187,600 |
| 2024 | $3,756 | $227,900 | $45,600 | $182,300 |
| 2023 | $2,972 | $227,900 | $45,600 | $182,300 |
| 2022 | $2,676 | $197,800 | $40,600 | $157,200 |
| 2021 | $2,580 | $175,600 | $36,000 | $139,600 |
| 2020 | $2,684 | $167,800 | $36,000 | $131,800 |
| 2019 | $2,568 | $162,200 | $36,000 | $126,200 |
| 2018 | $2,300 | $153,600 | $36,000 | $117,600 |
| 2017 | $2,000 | $136,300 | $29,000 | $107,300 |
| 2016 | $1,908 | $129,500 | $29,000 | $100,500 |
| 2015 | $1,800 | $118,500 | $29,000 | $89,500 |
| 2014 | -- | $113,000 | $23,500 | $89,500 |
Source: Public Records
Map
Nearby Homes
- 1504 Pheasantwood Trail
- 1707 Jackson Ct
- 1741 Roosevelt Dr
- 1513 Senate Ln
- 1819 Truman Ct
- 1301 Presidential Dr
- 2004 Lincoln St S
- 2206 Grant Ct
- 709 Carter Dr
- 2116 Park Pointe Dr
- 1011 Poplar St
- 2200 Greenfield Dr W
- 2220 Greenfield Dr E
- XXXX Division St S
- 119 Woodley St W
- 1603 Washington St
- 307 8th St W
- Outlot Honeylocust Dr
- 917 Division St S
- XXXX Harvest Hills Outlook
- 1606 Pheasantwood Trail
- 1604 Pheasantwood Trail
- 1608 Pheasantwood Trail
- 1601 Pheasantwood Trail
- 1605 Pheasantwood Trail
- 1506 Pheasantwood Trail
- 1545 Pheasantwood Trail
- 1502 Pheasantwood Trail
- 1617 Pheasantwood Trail
- 1613 Pheasantwood Trail
- 1621 Pheasantwood Trail
- 1609 Pheasantwood Trail
- 1541 Pheasantwood Trail
- 1629 1629 Pleasantwood-Trail-
- 1625 Pheasantwood Trail
- 1629 Pheasantwood Trail
- 1629 Pleasantwood Trail
- 1547 Pheasantwood Trail
- 1603 Pheasantwood Trail
- 1607 Pheasantwood Trail