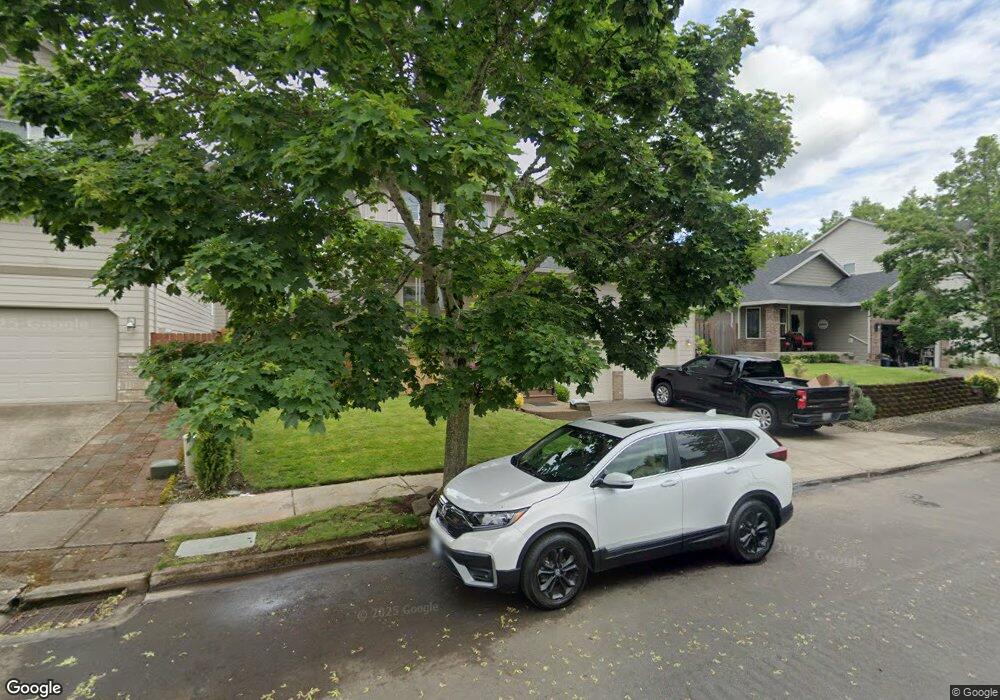
1602 SE Larch Way Gresham, OR 97080
Kelly Creek NeighborhoodEstimated Value: $556,000 - $633,000
3
Beds
3
Baths
2,562
Sq Ft
$227/Sq Ft
Est. Value
About This Home
This home is located at 1602 SE Larch Way, Gresham, OR 97080 and is currently estimated at $582,477, approximately $227 per square foot. 1602 SE Larch Way is a home located in Multnomah County with nearby schools including Powell Valley Elementary School, Gordon Russell Middle School, and Sam Barlow High School.
Ownership History
Date
Name
Owned For
Owner Type
Purchase Details
Closed on
Dec 11, 2012
Sold by
Vadnais Vance
Bought by
Vadnais Vance E and Vadnais Athena
Current Estimated Value
Home Financials for this Owner
Home Financials are based on the most recent Mortgage that was taken out on this home.
Original Mortgage
$241,460
Outstanding Balance
$166,537
Interest Rate
3.35%
Mortgage Type
FHA
Estimated Equity
$415,940
Purchase Details
Closed on
Nov 19, 2004
Sold by
Rodgers Daryl B
Bought by
Vadnais Vance and Vadnais Athena
Home Financials for this Owner
Home Financials are based on the most recent Mortgage that was taken out on this home.
Original Mortgage
$212,400
Interest Rate
5.72%
Mortgage Type
Purchase Money Mortgage
Purchase Details
Closed on
Nov 16, 2001
Sold by
Riverside Homes Inc
Bought by
Rodgers Daryl B and Rodgers Tracey L
Home Financials for this Owner
Home Financials are based on the most recent Mortgage that was taken out on this home.
Original Mortgage
$164,760
Interest Rate
6.62%
Mortgage Type
Purchase Money Mortgage
Create a Home Valuation Report for This Property
The Home Valuation Report is an in-depth analysis detailing your home's value as well as a comparison with similar homes in the area
Home Values in the Area
Average Home Value in this Area
Purchase History
| Date | Buyer | Sale Price | Title Company |
|---|---|---|---|
| Vadnais Vance E | -- | Stewart Title | |
| Vadnais Vance | $265,500 | Ticor Title Insurance Compan | |
| Rodgers Daryl B | $205,950 | Fidelity National Title Co |
Source: Public Records
Mortgage History
| Date | Status | Borrower | Loan Amount |
|---|---|---|---|
| Open | Vadnais Vance E | $241,460 | |
| Closed | Vadnais Vance | $212,400 | |
| Previous Owner | Rodgers Daryl B | $164,760 | |
| Closed | Rodgers Daryl B | $30,890 | |
| Closed | Vadnais Vance | $53,100 |
Source: Public Records
Tax History
| Year | Tax Paid | Tax Assessment Tax Assessment Total Assessment is a certain percentage of the fair market value that is determined by local assessors to be the total taxable value of land and additions on the property. | Land | Improvement |
|---|---|---|---|---|
| 2025 | $6,101 | $299,790 | -- | -- |
| 2024 | $5,840 | $291,060 | -- | -- |
| 2023 | $5,321 | $282,590 | $0 | $0 |
| 2022 | $5,172 | $274,360 | $0 | $0 |
| 2021 | $5,041 | $266,370 | $0 | $0 |
| 2020 | $4,744 | $258,620 | $0 | $0 |
| 2019 | $4,619 | $251,090 | $0 | $0 |
| 2018 | $4,405 | $243,780 | $0 | $0 |
| 2017 | $4,226 | $236,680 | $0 | $0 |
| 2016 | $3,726 | $229,790 | $0 | $0 |
Source: Public Records
Map
Nearby Homes
- 5827 SE 16th Loop
- 5856 SE Woodland Dr
- Pepperwood Plan at The Vineyards at Blue Pearl
- Glacier Plan at The Vineyards at Blue Pearl
- 6103 SE 16th St
- 6109 SE 16th St
- 6115 SE 16th St
- 1490 SE Pheasant Ave
- 6171 SE 16th St
- 6187 SE 16th St
- 6195 SE 16th St
- 6192 SE 15th St
- 2404 SE Jasmine Way
- 2314 SE Keller Ave
- 6421 SE 22nd St
- 6443 SE 22nd St
- 6490 SE 21st St
- 6433 SE 23rd St
- 1536 SE Condor Ave
- 5400 SE Chase Rd
- 1590 SE Larch Way
- 1606 SE Larch Way
- 1603 SE Mimosa Dr
- 1647 SE Mimosa Dr
- 1579 SE Mimosa Dr
- 1576 SE Larch Way
- 1630 SE Larch Way
- 5696 SE 16th Dr
- 1561 SE Mimosa Dr
- 1691 SE Mimosa Dr
- 1589 SE Larch Way
- 1544 SE Larch Way
- 1575 SE Larch Way
- 1537 S Mimosa Dr
- 1537 SE Mimosa Dr
- 5660 SE 16th Dr
- 1545 SE Larch Way
- 1543 SE Larch Way
- 1510 SE Larch Way
- 1633 SE Larch Way
Your Personal Tour Guide
Ask me questions while you tour the home.