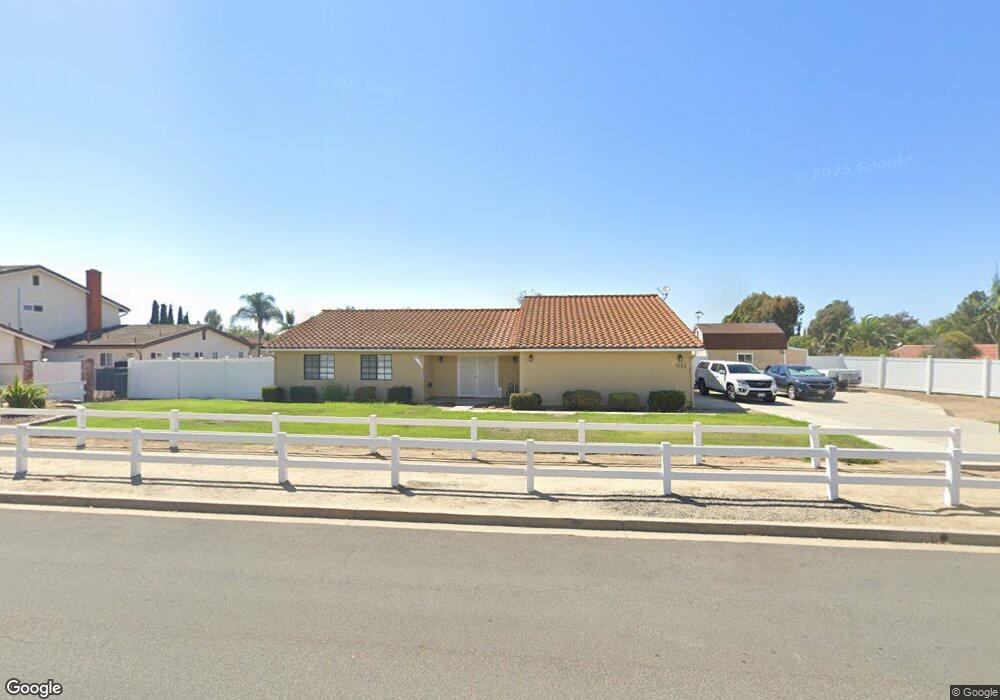
1603 Hackamore Rd Oceanside, CA 92057
Guajome NeighborhoodEstimated Value: $983,000 - $1,064,000
3
Beds
2
Baths
1,789
Sq Ft
$574/Sq Ft
Est. Value
About This Home
This home is located at 1603 Hackamore Rd, Oceanside, CA 92057 and is currently estimated at $1,027,752, approximately $574 per square foot. 1603 Hackamore Rd is a home located in San Diego County with nearby schools including Mission Meadows Elementary School, Roosevelt Middle School, and Vista High School.
Ownership History
Date
Name
Owned For
Owner Type
Purchase Details
Closed on
Mar 1, 2025
Sold by
Austin David F and Austin Susan H
Bought by
Austin
Current Estimated Value
Purchase Details
Closed on
Sep 20, 2010
Sold by
Estate Of Ronald Alfred Ferguson and Rodriguez Guadalupe
Bought by
Austin David F and Austin Susan H
Home Financials for this Owner
Home Financials are based on the most recent Mortgage that was taken out on this home.
Original Mortgage
$318,000
Interest Rate
4.28%
Mortgage Type
New Conventional
Purchase Details
Closed on
Apr 22, 2003
Sold by
Curtin Ellen S
Bought by
Ferguson Ronald A
Home Financials for this Owner
Home Financials are based on the most recent Mortgage that was taken out on this home.
Original Mortgage
$314,000
Interest Rate
5.75%
Mortgage Type
Purchase Money Mortgage
Purchase Details
Closed on
Sep 2, 1993
Sold by
Bunning John George and Bunning Dorothy Ruth
Bought by
Curtin John R and Curtin Ellen S
Purchase Details
Closed on
May 26, 1988
Purchase Details
Closed on
Jul 12, 1984
Create a Home Valuation Report for This Property
The Home Valuation Report is an in-depth analysis detailing your home's value as well as a comparison with similar homes in the area
Home Values in the Area
Average Home Value in this Area
Purchase History
| Date | Buyer | Sale Price | Title Company |
|---|---|---|---|
| Austin | -- | None Listed On Document | |
| Austin David F | $410,000 | First American Title Company | |
| Ferguson Ronald A | $444,000 | Commonwealth Land Title Co | |
| Curtin John R | $184,000 | Commonwealth Land Title Co | |
| -- | $165,000 | -- | |
| -- | $41,500 | -- |
Source: Public Records
Mortgage History
| Date | Status | Borrower | Loan Amount |
|---|---|---|---|
| Previous Owner | Austin David F | $318,000 | |
| Previous Owner | Ferguson Ronald A | $314,000 |
Source: Public Records
Tax History
| Year | Tax Paid | Tax Assessment Tax Assessment Total Assessment is a certain percentage of the fair market value that is determined by local assessors to be the total taxable value of land and additions on the property. | Land | Improvement |
|---|---|---|---|---|
| 2025 | $5,645 | $525,266 | $307,473 | $217,793 |
| 2024 | $5,645 | $514,968 | $301,445 | $213,523 |
| 2023 | $5,510 | $504,872 | $295,535 | $209,337 |
| 2022 | $5,496 | $494,974 | $289,741 | $205,233 |
| 2021 | $5,373 | $485,269 | $284,060 | $201,209 |
| 2020 | $5,355 | $480,294 | $281,148 | $199,146 |
| 2019 | $5,276 | $470,878 | $275,636 | $195,242 |
| 2018 | $5,015 | $461,646 | $270,232 | $191,414 |
| 2017 | $4,923 | $452,595 | $264,934 | $187,661 |
| 2016 | $4,807 | $443,722 | $259,740 | $183,982 |
| 2015 | $4,788 | $437,058 | $255,839 | $181,219 |
| 2014 | $4,670 | $428,498 | $250,828 | $177,670 |
Source: Public Records
Map
Nearby Homes
- 5837 Jeffries Ranch Rd
- 5761 Spur Ave
- 5768 Old Ranch Rd
- 5639 Pony Ct
- 5654 Tumbleweed Way
- 1489 Goldrush Way
- 1690 Bronco Way
- 1681 Charlie Horse Way
- 1684 Charlie Horse Way
- 2278 Bautista Ave
- 5517 Old Ranch Rd Unit 29
- 2205 Bautista Ave
- 554 Edgewater Ave
- 2428 Hutchison St
- 2909 Harris Dr
- 291 Osborne St
- 1513 Powell Rd
- 2245 Maelee Dr
- 2067 Paseo de Anza
- 5259 Hubbert St
- 1607 Hackamore Rd
- 5853 Jeffries Ranch Rd
- 1602 Wagon Wheel Dr
- 5857 Jeffries Ranch Rd
- 1614 Hackamore Rd
- 1604 Wagon Wheel Dr
- 5847 Jeffries Ranch Rd
- 1610 Hackamore Rd
- 1611 Hackamore Rd
- 1616 Hackamoe
- 1616 Hackamore Rd
- 1606 Hackamore Rd
- 1608 Wagon Wheel Dr
- 1618 Hackamore Rd
- 1615 Hackamore Rd
- 1602 Hackamore Rd
- 1596 Wagon Wheel Dr
- 5841 Jeffries Ranch Rd
- 1625 Trotting Horse Rd
- 1613 Trotting Horse Rd
Your Personal Tour Guide
Ask me questions while you tour the home.