
Landlord's Agent in 2023
Stephen Ladig
Ladig Realty, LLC
(317) 414-4675
11 in this area
23 Total Sales
Estimated Value: $309,000 - $329,000
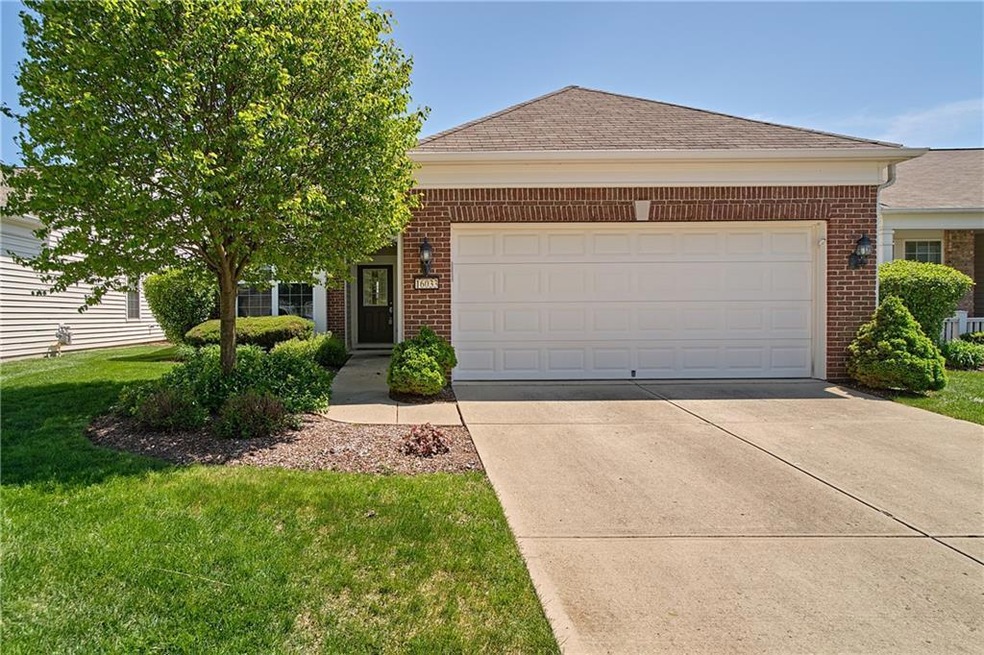
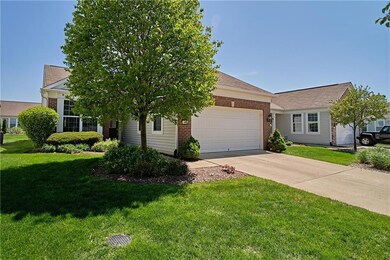
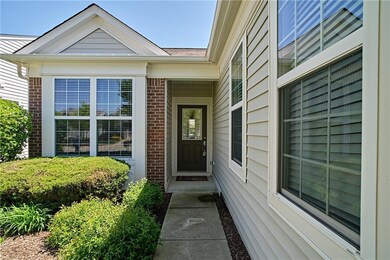
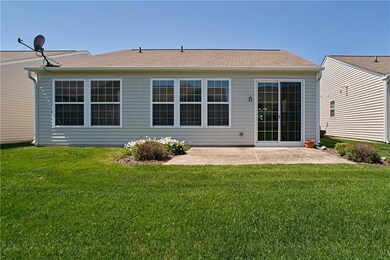
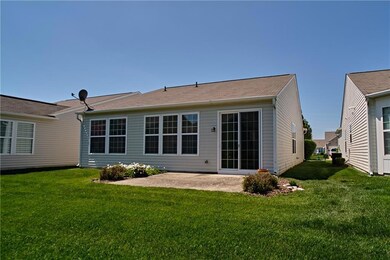
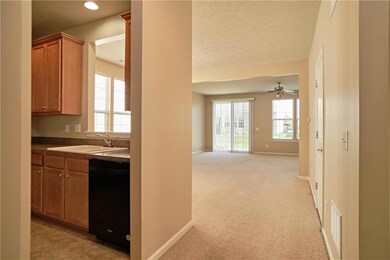
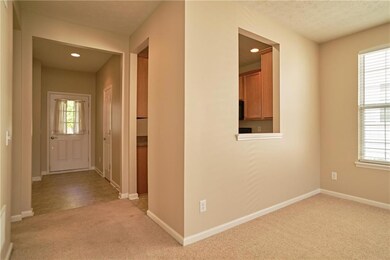
Britton Falls, a Del Webb Community for 55 or Better! Great room, Dining Room, Kitchen with separate Nook area, Master Bedroom, Large Walk In Closet, 2nd Bedroom/Study, 2 1/2 Car Garage. 9' Ceilings, Chrome Grab Bars @shower/tub. Irrigation system, Lawn/Maintenance included. Community Rec Center includes year round pool, tennis, computer center, fitness center, Billiards, Arts/Ceramic Room, Business Center, Library with Internet Access, On-Site Lifestyle Director. Pets with Approval $25/mo plus additional $300 Security Deposit. Tenant pays monthly HOA dues of $244 (currently). Washer and Dryer available for $50/mo. This property requires you to be minimum 50 yrs old with no kids under 19 living with you.
Last Agent to Rent the Property
Ladig Realty, LLC License #RB14035321 Listed on: 08/21/2023
Last Renter's Agent
Hollie Oman
Ladig Realty, LLC
| Date | Buyer | Sale Price | Title Company |
|---|---|---|---|
| Ladig Stephen J | -- | Ctic Fishers |
| Date | Status | Borrower | Loan Amount |
|---|---|---|---|
| Open | Ladig Stephen J | $16,909 |
| Date | Event | Price | List to Sale | Price per Sq Ft |
|---|---|---|---|---|
| 09/22/2023 09/22/23 | Rented | $1,800 | 0.0% | -- |
| 08/21/2023 08/21/23 | For Rent | $1,800 | +5.9% | -- |
| 09/01/2022 09/01/22 | Rented | $1,700 | 0.0% | -- |
| 08/02/2022 08/02/22 | For Rent | $1,700 | +6.3% | -- |
| 07/30/2021 07/30/21 | Rented | -- | -- | -- |
| 07/08/2021 07/08/21 | For Rent | $1,600 | +20.8% | -- |
| 12/26/2018 12/26/18 | Rented | $1,324 | +1.9% | -- |
| 12/11/2018 12/11/18 | For Rent | $1,299 | +3.9% | -- |
| 09/28/2017 09/28/17 | Rented | $1,250 | 0.0% | -- |
| 09/05/2017 09/05/17 | For Rent | $1,250 | +2.0% | -- |
| 09/19/2016 09/19/16 | Rented | $1,225 | -2.0% | -- |
| 08/02/2016 08/02/16 | Price Changed | $1,250 | -3.8% | $1 / Sq Ft |
| 07/08/2016 07/08/16 | Price Changed | $1,299 | -3.7% | $1 / Sq Ft |
| 06/30/2016 06/30/16 | Price Changed | $1,349 | +10.1% | $1 / Sq Ft |
| 06/09/2016 06/09/16 | For Rent | $1,225 | -37.1% | -- |
| 08/12/2015 08/12/15 | Rented | $1,949 | +39.3% | -- |
| 08/12/2015 08/12/15 | Under Contract | -- | -- | -- |
| 06/16/2015 06/16/15 | For Rent | $1,399 | -3.3% | -- |
| 04/25/2014 04/25/14 | Rented | $1,446 | +15.7% | -- |
| 04/25/2014 04/25/14 | Under Contract | -- | -- | -- |
| 04/01/2014 04/01/14 | For Rent | $1,250 | -- | -- |
| Year | Tax Paid | Tax Assessment Tax Assessment Total Assessment is a certain percentage of the fair market value that is determined by local assessors to be the total taxable value of land and additions on the property. | Land | Improvement |
|---|---|---|---|---|
| 2024 | $4,080 | $196,100 | $60,000 | $136,100 |
| 2023 | $4,115 | $188,300 | $60,000 | $128,300 |
| 2022 | $3,966 | $177,000 | $60,000 | $117,000 |
| 2021 | $3,595 | $156,200 | $60,000 | $96,200 |
| 2020 | $3,614 | $166,800 | $60,000 | $106,800 |
| 2019 | $3,857 | $165,900 | $60,000 | $105,900 |
| 2018 | $3,867 | $175,600 | $60,000 | $115,600 |
| 2017 | $3,241 | $140,700 | $44,100 | $96,600 |
| 2016 | $3,269 | $142,800 | $44,100 | $98,700 |
| 2014 | $2,834 | $132,800 | $44,100 | $88,700 |
| 2013 | $2,834 | $136,800 | $44,100 | $92,700 |
Landlord's Agent in 2023
Stephen Ladig
Ladig Realty, LLC
(317) 414-4675
11 in this area
23 Total Sales
H
Tenant's Agent in 2023
Hollie Oman
Ladig Realty, LLC
D
Buyer's Agent in 2022
Deanna Baird
Berkshire Hathaway Home
S
Buyer's Agent in 2018
Susan Timmerman
Highgarden Real Estate
R
Buyer's Agent in 2017
Rebecca Chase
B
Buyer's Agent in 2015
Becky Blossom
Keller Williams Indy Metro NE
Source: MIBOR Broker Listing Cooperative®
MLS Number: 21939249
APN: 29-12-29-008-020.000-020
Disclaimer: Certain information contained herein is derived from information provided by parties other than Homes.com. All information provided is deemed reliable, but is not guaranteed to be accurate and should be independently verified.
![]() Based on information submitted to the MLS GRID. All data is obtained from various sources and may not have been verified by broker or MLS GRID. Supplied Open House Information is subject to change without notice. All information should be independently reviewed and verified for accuracy. Properties may or may not be listed by the office/agent presenting the information. Some IDX listings have been excluded from this website.
Based on information submitted to the MLS GRID. All data is obtained from various sources and may not have been verified by broker or MLS GRID. Supplied Open House Information is subject to change without notice. All information should be independently reviewed and verified for accuracy. Properties may or may not be listed by the office/agent presenting the information. Some IDX listings have been excluded from this website.