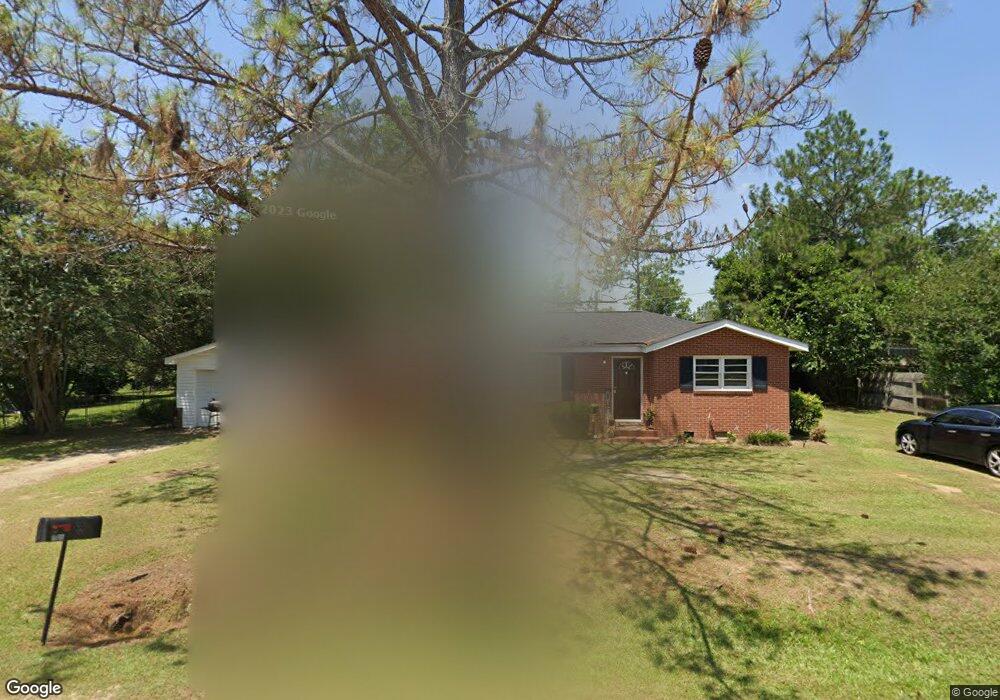
1604 S 5th St Cordele, GA 31015
Estimated Value: $81,000 - $168,000
4
Beds
2
Baths
1,123
Sq Ft
$99/Sq Ft
Est. Value
About This Home
This home is located at 1604 S 5th St, Cordele, GA 31015 and is currently estimated at $111,484, approximately $99 per square foot. 1604 S 5th St is a home located in Crisp County with nearby schools including Crisp County Elementary School, Crisp County Primary School, and Crisp County Middle School.
Ownership History
Date
Name
Owned For
Owner Type
Purchase Details
Closed on
May 17, 2019
Sold by
Racine Michael Shane
Bought by
Fort Jacqueline A
Current Estimated Value
Home Financials for this Owner
Home Financials are based on the most recent Mortgage that was taken out on this home.
Original Mortgage
$64,804
Outstanding Balance
$56,860
Interest Rate
4.1%
Mortgage Type
FHA
Estimated Equity
$54,624
Purchase Details
Closed on
Aug 15, 2012
Sold by
Turner Daniell Russell
Bought by
Racine Michael Shane and Rachine April Turner
Purchase Details
Closed on
May 16, 2012
Sold by
Turner Mary H
Bought by
Turner Daniell Russell
Purchase Details
Closed on
Nov 18, 1996
Sold by
Hutchinson Lee W
Bought by
Turner Mary H
Purchase Details
Closed on
Feb 26, 1971
Sold by
Vonier W D
Bought by
Hutchinson Lee W
Purchase Details
Closed on
Apr 25, 1968
Bought by
Vonier W D
Create a Home Valuation Report for This Property
The Home Valuation Report is an in-depth analysis detailing your home's value as well as a comparison with similar homes in the area
Home Values in the Area
Average Home Value in this Area
Purchase History
| Date | Buyer | Sale Price | Title Company |
|---|---|---|---|
| Fort Jacqueline A | $66,000 | -- | |
| Racine Michael Shane | $35,000 | -- | |
| Turner Daniell Russell | -- | -- | |
| Turner Mary H | -- | -- | |
| Hutchinson Lee W | -- | -- | |
| Vonier W D | -- | -- |
Source: Public Records
Mortgage History
| Date | Status | Borrower | Loan Amount |
|---|---|---|---|
| Open | Fort Jacqueline A | $64,804 | |
| Closed | Racine Michael Shane | $0 |
Source: Public Records
Tax History Compared to Growth
Tax History
| Year | Tax Paid | Tax Assessment Tax Assessment Total Assessment is a certain percentage of the fair market value that is determined by local assessors to be the total taxable value of land and additions on the property. | Land | Improvement |
|---|---|---|---|---|
| 2024 | $982 | $28,777 | $3,183 | $25,594 |
| 2023 | $921 | $25,965 | $1,592 | $24,373 |
| 2022 | $601 | $24,744 | $1,592 | $23,152 |
| 2021 | $589 | $23,524 | $1,592 | $21,932 |
| 2020 | $662 | $23,524 | $1,592 | $21,932 |
| 2019 | $667 | $23,524 | $1,592 | $21,932 |
| 2018 | $686 | $23,285 | $2,546 | $20,739 |
| 2017 | $946 | $23,285 | $2,546 | $20,739 |
| 2016 | $689 | $23,285 | $2,546 | $20,739 |
| 2015 | -- | $23,285 | $2,546 | $20,739 |
| 2014 | -- | $23,285 | $2,546 | $20,739 |
| 2013 | -- | $23,285 | $2,546 | $20,738 |
Source: Public Records
Map
Nearby Homes
- 1606 S 5th St
- 510 E 25th Ave
- 618 E 27th Ave
- 607 E 27th Ave
- 615 E 28th Ave
- 619 E 26th Ave
- 616 E 23rd Ave
- 724 E 26th Ave
- 723 E 24th Ave
- 910 S 4th St
- 909 S 6th St
- 906 S 5th St
- 1506 S Joe Wright Dr
- 705 E 21st Ave
- 316 E 18th Ave
- 720 E 20th Ave
- 1002 Camellia Dr
- 701 S 3rd St
- 0 E 17th Unit 57650
- 912 Rose Ln