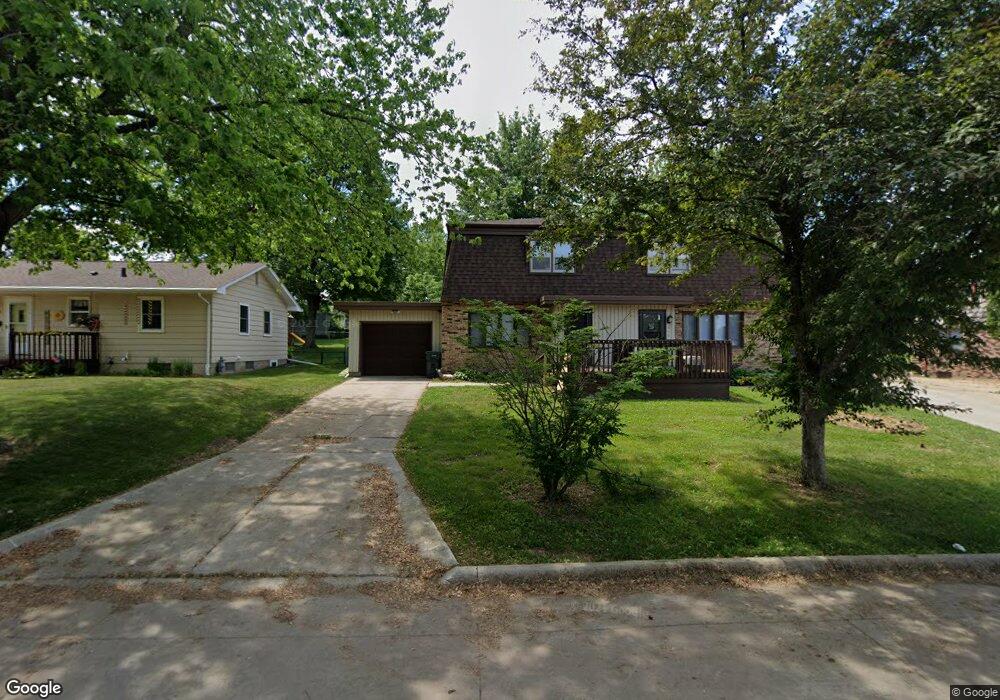
1604 W 6th St Unit 1606 Cedar Falls, IA 50613
Estimated Value: $215,000 - $319,139
6
Beds
4
Baths
2,344
Sq Ft
$120/Sq Ft
Est. Value
About This Home
This home is located at 1604 W 6th St Unit 1606, Cedar Falls, IA 50613 and is currently estimated at $281,035, approximately $119 per square foot. 1604 W 6th St Unit 1606 is a home located in Black Hawk County with nearby schools including Lincoln Elementary School, Holmes Junior High School, and Cedar Falls High School.
Ownership History
Date
Name
Owned For
Owner Type
Purchase Details
Closed on
Jan 3, 2020
Sold by
Mccarty Rentals Llc
Bought by
Howard Brad M and Howard Cassie R
Current Estimated Value
Home Financials for this Owner
Home Financials are based on the most recent Mortgage that was taken out on this home.
Original Mortgage
$183,891
Outstanding Balance
$162,126
Interest Rate
3.6%
Mortgage Type
New Conventional
Estimated Equity
$118,909
Purchase Details
Closed on
Feb 15, 2006
Sold by
Pierce Lynn D and Pierce Becky S
Bought by
Mccarty John A and Mccarty Diane M
Home Financials for this Owner
Home Financials are based on the most recent Mortgage that was taken out on this home.
Original Mortgage
$144,000
Interest Rate
6.2%
Mortgage Type
Credit Line Revolving
Create a Home Valuation Report for This Property
The Home Valuation Report is an in-depth analysis detailing your home's value as well as a comparison with similar homes in the area
Home Values in the Area
Average Home Value in this Area
Purchase History
| Date | Buyer | Sale Price | Title Company |
|---|---|---|---|
| Howard Brad M | $216,500 | None Available | |
| Mccarty John A | $180,000 | Black Hawk County Abstract C |
Source: Public Records
Mortgage History
| Date | Status | Borrower | Loan Amount |
|---|---|---|---|
| Open | Howard Brad M | $183,891 | |
| Previous Owner | Mccarty John A | $144,000 |
Source: Public Records
Tax History
| Year | Tax Paid | Tax Assessment Tax Assessment Total Assessment is a certain percentage of the fair market value that is determined by local assessors to be the total taxable value of land and additions on the property. | Land | Improvement |
|---|---|---|---|---|
| 2025 | $4,802 | $329,710 | $58,310 | $271,400 |
| 2024 | $4,802 | $298,450 | $37,490 | $260,960 |
| 2023 | $4,304 | $298,450 | $37,490 | $260,960 |
| 2022 | $4,356 | $233,120 | $37,490 | $195,630 |
| 2021 | $4,146 | $233,120 | $37,490 | $195,630 |
| 2020 | $4,064 | $222,700 | $27,070 | $195,630 |
| 2019 | $4,064 | $222,700 | $27,070 | $195,630 |
| 2018 | $3,764 | $203,670 | $27,070 | $176,600 |
| 2017 | $3,850 | $203,670 | $27,070 | $176,600 |
| 2016 | $3,604 | $203,930 | $27,070 | $176,860 |
| 2015 | $3,604 | $203,930 | $27,070 | $176,860 |
| 2014 | $3,502 | $195,900 | $27,070 | $168,830 |
Source: Public Records
Map
Nearby Homes
Your Personal Tour Guide
Ask me questions while you tour the home.