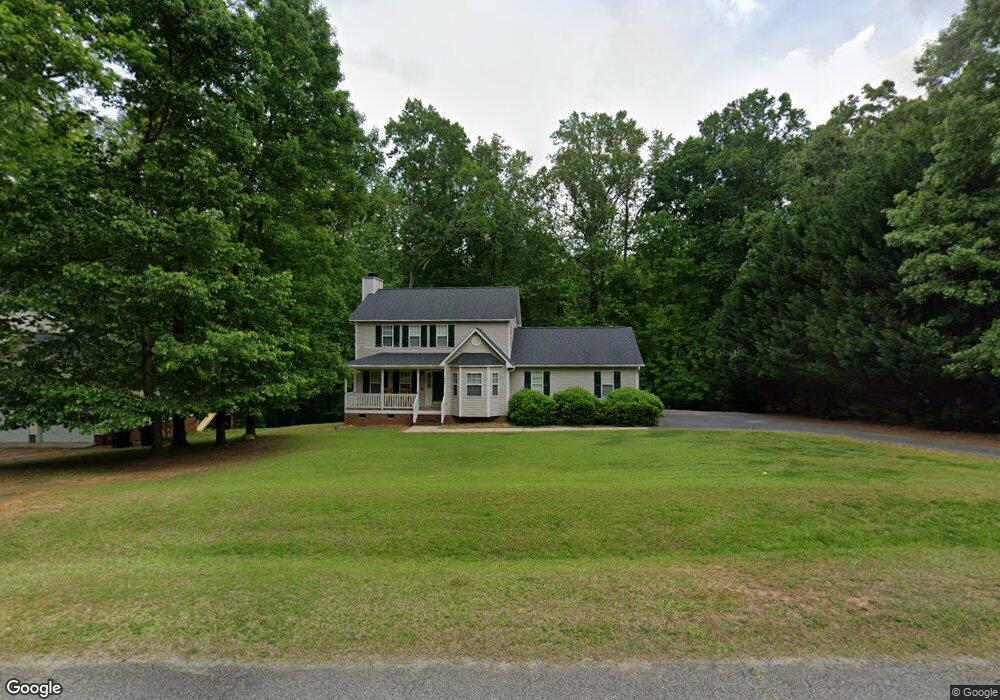
1605 Middle Ridge Dr Willow Spring, NC 27592
Estimated Value: $349,000 - $358,000
3
Beds
3
Baths
1,575
Sq Ft
$224/Sq Ft
Est. Value
About This Home
This home is located at 1605 Middle Ridge Dr, Willow Spring, NC 27592 and is currently estimated at $353,577, approximately $224 per square foot. 1605 Middle Ridge Dr is a home located in Wake County with nearby schools including Banks Road Elementary School and West Lake Middle.
Ownership History
Date
Name
Owned For
Owner Type
Purchase Details
Closed on
Apr 24, 2008
Sold by
Fowler Stewart A and Fowler Amy M
Bought by
Mccarthy Patrick T
Current Estimated Value
Home Financials for this Owner
Home Financials are based on the most recent Mortgage that was taken out on this home.
Original Mortgage
$161,400
Outstanding Balance
$95,562
Interest Rate
4.75%
Mortgage Type
Purchase Money Mortgage
Estimated Equity
$258,015
Purchase Details
Closed on
Jan 30, 2001
Sold by
Comfort Homes Inc
Bought by
Harvey Michael T and Harvey Deborah J
Home Financials for this Owner
Home Financials are based on the most recent Mortgage that was taken out on this home.
Original Mortgage
$142,800
Interest Rate
7.44%
Mortgage Type
VA
Create a Home Valuation Report for This Property
The Home Valuation Report is an in-depth analysis detailing your home's value as well as a comparison with similar homes in the area
Home Values in the Area
Average Home Value in this Area
Purchase History
| Date | Buyer | Sale Price | Title Company |
|---|---|---|---|
| Mccarthy Patrick T | $170,000 | None Available | |
| Harvey Michael T | $140,000 | -- |
Source: Public Records
Mortgage History
| Date | Status | Borrower | Loan Amount |
|---|---|---|---|
| Open | Mccarthy Patrick T | $161,400 | |
| Previous Owner | Harvey Michael T | $142,800 |
Source: Public Records
Tax History
| Year | Tax Paid | Tax Assessment Tax Assessment Total Assessment is a certain percentage of the fair market value that is determined by local assessors to be the total taxable value of land and additions on the property. | Land | Improvement |
|---|---|---|---|---|
| 2025 | $2,356 | $365,156 | $90,000 | $275,156 |
| 2024 | $2,288 | $365,156 | $90,000 | $275,156 |
Source: Public Records
Map
Nearby Homes
- 1636 Middle Ridge Dr
- 6304 Walnut Glen Dr
- 1425 Tawny View Ln
- 1417 Pleasant Quail Ct
- 6512 Blalock Forest Dr
- 1305 Tawny View Ln
- 1133 Farmers Branch Rd
- 1104 Taylor Farm Rd
- 3748 Norman Blalock Rd
- 6521 Camellia Creek Dr
- 1117 Leach St
- 5904 Dahlberg Dr
- 936 Elbridge Dr
- 2015 Stone Pasture Rd
- 10601 Fanny Brown Rd
- 7308 Messenger Dr
- 2024 Stone Pasture Rd
- 821 Comice Pear Way
- 1509 Immagene Way Unit 85
- 824 Comice Pear Way
- 1609 Middle Ridge Dr
- 1601 Middle Ridge Dr
- 1613 Middle Ridge Dr
- 1604 Middle Ridge Dr
- 1547 Middle Ridge Dr
- 1600 Middle Ridge Dr
- 1616 Middle Ridge Dr
- 1617 Middle Ridge Dr
- 1543 Middle Ridge Dr
- 3116 Eric St
- 1620 Middle Ridge Dr
- 6205 Lost Acorn Way
- 1550 Middle Ridge Dr
- 6301 Lost Acorn Way
- 3120 Eric St
- 6305 Lost Acorn Way
- 1539 Middle Ridge Dr
- 3124 Eric St
- 1546 Middle Ridge Dr
- 3112 Eric St
Your Personal Tour Guide
Ask me questions while you tour the home.