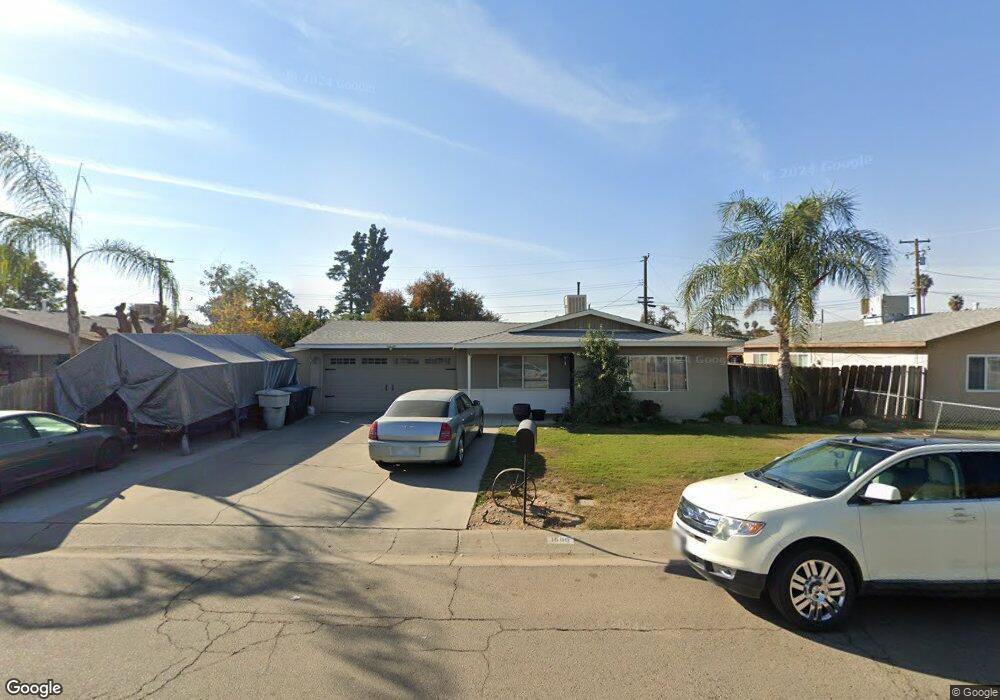
1605 N Bradley St Visalia, CA 93292
North Visalia NeighborhoodEstimated Value: $289,649 - $318,000
3
Beds
3
Baths
1,212
Sq Ft
$253/Sq Ft
Est. Value
About This Home
This home is located at 1605 N Bradley St, Visalia, CA 93292 and is currently estimated at $307,162, approximately $253 per square foot. 1605 N Bradley St is a home located in Tulare County with nearby schools including Four Creeks Elementary School, Valley Oak Middle School, and Golden West High School.
Ownership History
Date
Name
Owned For
Owner Type
Purchase Details
Closed on
Mar 23, 2021
Sold by
Franco Jerry and Hernandez Tamara
Bought by
Hernandez Tamara
Current Estimated Value
Home Financials for this Owner
Home Financials are based on the most recent Mortgage that was taken out on this home.
Original Mortgage
$138,888
Outstanding Balance
$125,127
Interest Rate
3%
Mortgage Type
FHA
Estimated Equity
$182,035
Purchase Details
Closed on
Jan 23, 1996
Sold by
Ramsdell George Melford
Bought by
Franco Jerry and Franco Tammy
Home Financials for this Owner
Home Financials are based on the most recent Mortgage that was taken out on this home.
Original Mortgage
$75,935
Interest Rate
7.41%
Mortgage Type
FHA
Purchase Details
Closed on
May 25, 1995
Sold by
Ramsdell Evelyn Florence
Bought by
Ramsdell George Melford
Create a Home Valuation Report for This Property
The Home Valuation Report is an in-depth analysis detailing your home's value as well as a comparison with similar homes in the area
Home Values in the Area
Average Home Value in this Area
Purchase History
| Date | Buyer | Sale Price | Title Company |
|---|---|---|---|
| Hernandez Tamara | -- | Stewart Title Of Ca Inc | |
| Franco Jerry | $76,000 | Fidelity National Title | |
| Ramsdell George Melford | -- | -- |
Source: Public Records
Mortgage History
| Date | Status | Borrower | Loan Amount |
|---|---|---|---|
| Open | Hernandez Tamara | $138,888 | |
| Previous Owner | Franco Jerry | $75,935 |
Source: Public Records
Tax History Compared to Growth
Tax History
| Year | Tax Paid | Tax Assessment Tax Assessment Total Assessment is a certain percentage of the fair market value that is determined by local assessors to be the total taxable value of land and additions on the property. | Land | Improvement |
|---|---|---|---|---|
| 2025 | $1,338 | $126,253 | $41,529 | $84,724 |
| 2024 | $1,338 | $123,778 | $40,715 | $83,063 |
| 2023 | $1,301 | $121,352 | $39,917 | $81,435 |
| 2022 | $1,261 | $118,974 | $39,135 | $79,839 |
| 2021 | $1,245 | $116,642 | $38,368 | $78,274 |
| 2020 | $1,229 | $115,446 | $37,975 | $77,471 |
| 2019 | $1,199 | $113,182 | $37,230 | $75,952 |
| 2018 | $1,164 | $110,963 | $36,500 | $74,463 |
| 2017 | $1,157 | $108,787 | $35,784 | $73,003 |
| 2016 | $1,130 | $106,654 | $35,082 | $71,572 |
| 2015 | $1,098 | $105,052 | $34,555 | $70,497 |
| 2014 | $1,098 | $102,994 | $33,878 | $69,116 |
Source: Public Records
Map
Nearby Homes
- 841 E Prospect Ave
- 1633 N Tipton St
- 636 E Roosevelt Ave
- 1502 E Buena Vista Ave
- 1146 E Buena Vista Ave
- 1145 E Ferguson Ave
- 1205 E Ferguson Ave
- 625 E Ferguson Ave
- 2218 N Oakhurst St
- 339 NE 4th Ave
- 1107 N Enos St
- 2241 N Edison St
- 312 NE 4th Ave
- 203 E Harold Ct
- 1915 E Houston Ave
- 2419 N Clark St
- 2420 N Michael St
- 4106 E Oakridge Ave
- 4109 E Oakridge Ave
- 2435 N Clark St
- 1545 N Bradley St
- 1615 N Bradley St
- 1535 N Bradley St
- 1610 N Burke St
- 1604 N Bradley St
- 1600 N Burke St
- 1614 N Bradley St
- 1620 N Burke St
- 1542 N Bradley St
- 1540 N Burke St
- 1525 N Bradley St
- 1532 N Burke St
- 1530 N Bradley St
- 946 E Atkins Ave
- 934 E Atkins Ave
- 1603 N Edison St
- 1613 N Edison St
- 1012 E Atkins Ave
- 930 E Atkins Ave
- 1541 N Edison St