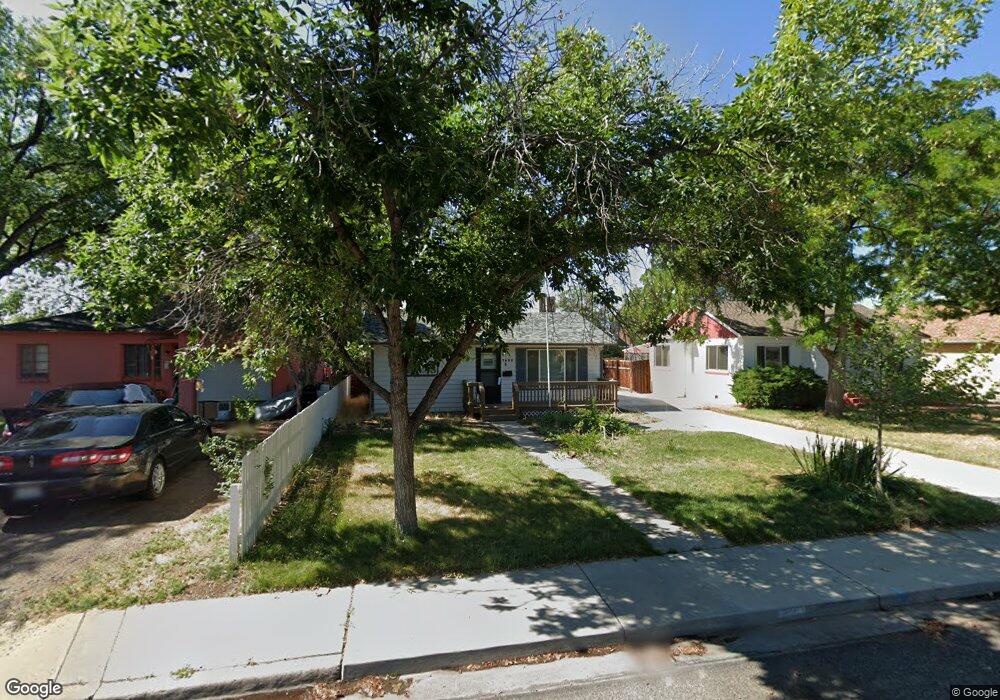
1605 Rood Ave Grand Junction, CO 81501
Downtown Grand Junction NeighborhoodEstimated Value: $284,162 - $298,000
2
Beds
1
Bath
864
Sq Ft
$337/Sq Ft
Est. Value
About This Home
This home is located at 1605 Rood Ave, Grand Junction, CO 81501 and is currently estimated at $291,541, approximately $337 per square foot. 1605 Rood Ave is a home located in Mesa County with nearby schools including Chipeta Elementary School, East Middle School, and West Middle School.
Ownership History
Date
Name
Owned For
Owner Type
Purchase Details
Closed on
Oct 30, 2017
Sold by
Thiel Andrew Oliver
Bought by
Thiel Andrew Oliver
Current Estimated Value
Purchase Details
Closed on
Aug 22, 2012
Sold by
Turcotte Sharlene M
Bought by
Matheus Sharlene M
Purchase Details
Closed on
Oct 8, 1997
Sold by
Rose P Haskins Eugene W
Bought by
Turcotte Sharlene Marie
Purchase Details
Closed on
Mar 23, 1972
Sold by
Haskins Herbert C
Bought by
Thiel Andrew Oliver
Purchase Details
Closed on
Mar 1, 1972
Sold by
Haskins Herbert C
Bought by
Thiel Andrew Oliver
Purchase Details
Closed on
Sep 2, 1970
Sold by
Moore Anna D
Bought by
Thiel Andrew Oliver
Create a Home Valuation Report for This Property
The Home Valuation Report is an in-depth analysis detailing your home's value as well as a comparison with similar homes in the area
Home Values in the Area
Average Home Value in this Area
Purchase History
| Date | Buyer | Sale Price | Title Company |
|---|---|---|---|
| Thiel Andrew Oliver | -- | None Available | |
| Matheus Sharlene M | -- | None Available | |
| Turcotte Sharlene Marie | $66,000 | -- | |
| Thiel Andrew Oliver | -- | -- | |
| Thiel Andrew Oliver | -- | -- | |
| Thiel Andrew Oliver | $10,500 | -- |
Source: Public Records
Tax History Compared to Growth
Tax History
| Year | Tax Paid | Tax Assessment Tax Assessment Total Assessment is a certain percentage of the fair market value that is determined by local assessors to be the total taxable value of land and additions on the property. | Land | Improvement |
|---|---|---|---|---|
| 2024 | $928 | $13,130 | $4,450 | $8,680 |
| 2023 | $928 | $13,130 | $4,450 | $8,680 |
| 2022 | $937 | $13,000 | $4,520 | $8,480 |
| 2021 | $941 | $13,380 | $4,650 | $8,730 |
| 2020 | $731 | $10,640 | $3,580 | $7,060 |
| 2019 | $691 | $10,640 | $3,580 | $7,060 |
| 2018 | $708 | $10,000 | $3,240 | $6,760 |
| 2017 | $264 | $10,000 | $3,240 | $6,760 |
| 2016 | $264 | $8,430 | $3,380 | $5,050 |
| 2015 | $268 | $8,430 | $3,380 | $5,050 |
| 2014 | $241 | $7,630 | $2,790 | $4,840 |
Source: Public Records
Map
Nearby Homes